 Research Publication
The State of State Owned Enterprises 2022
5, August 2022
135 min read
Contributors
- Mr. Ravi Ratnasabapathy – Chief Project Consultant
- Rehana Thowfeek – Associate, Advocata Institute/ Co-Project Consultant
- K.D.D.B.Vimanga – Policy Analyst
- Anuka Ratnayake – Research Assistant
- Aaditha Edirisinghe – Researcher
- Migara Rodrigo – Research Intern
- Malisha Weerasinghe – Research Intern
- Jessica Peerez – Legal Research Intern
- Thathsarani Siriwardana – Research Intern
Acknowledgements
This report was prepared by Mr. Ravi Ratnasabapathy, Main Project Consultant, Rehana Thowfeek, Associate of the Advocata Institute, and the Advocata Institute Research Team.
This project would not have been possible without the gracious support of many people who contributed their time, offered advice and helped in innumerable ways.
In particular, we wish to thank Dr. Malathy Knight, Project Consultant, for her overall guidance and oversight of the project; our Academic Chair, Dr. Sarath Rajapatirana, for his guidance and encouragement, and our Board of Directors – especially Mr. Deane Jayamanne and Mr. Dhananath Fernando, Advocata’s COO, for their continued support and guidance throughout the project.
Finally, we would also like to express our gratitude to Advocata Institute’s Expert Committee on State Owned Enterprises: Professor Rohan Samarajeewa, Dr. R.H.S. Samaratunga, Mr. Daniel Alphonsus, Dr. Roshan Perera, Dr. Malathy Knight, Dr. Sujatha Gamage, Mr. Asoka Peiris, and Dr. Sarath Rajapatirana for their kind voluntary contribution which aided immensely in steering this project to successful completion.
Foreword
As a think tank, Advocata Institute focuses on important issues faced by the country related to economic and social areas. We analyse them and propose solutions. This work recommends policies and solutions to the problems.
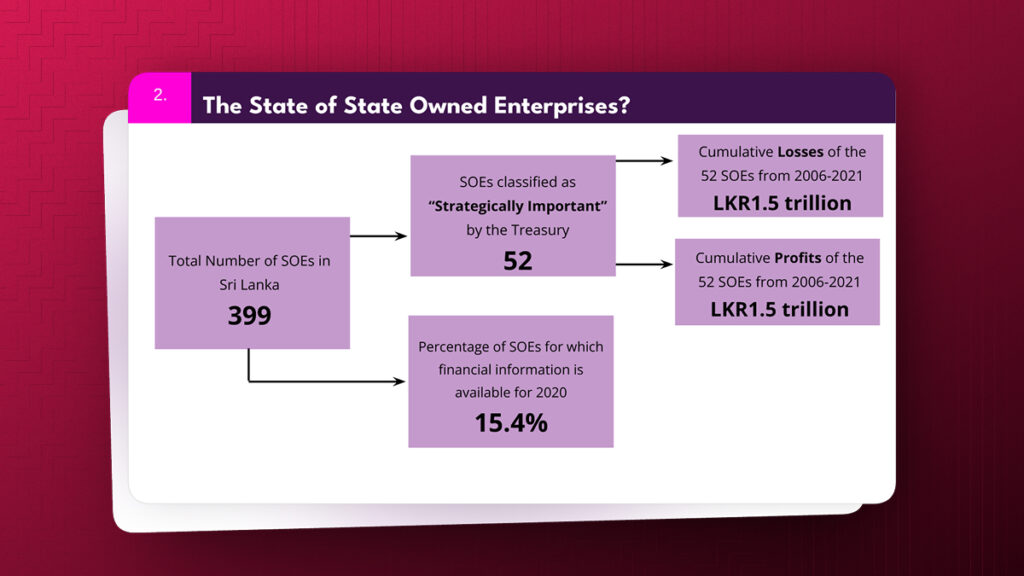
In this present quest we have focused on State Owned Enterprises (SOEs) despite difficulties in finding adequate and up-to-date information on their management practices and accounts. We found essential data on 52 enterprises out of some 500 SOE’s operating in different sectors. We believe it is an adequate sample to draw conclusions about the state of these enterprises.
As a group, these SOEs have suffered large losses that have contributed to the present macroeconomic problems facing the country. The state has to make good on these losses, increasing public deficits that have to be financed by borrowing from the Central Bank, has exacerbated this issue further, which has brought high inflationary pressures into the economy. Losses of these enterprises contribute to macroeconomic instability given the perilous state of our overall finances. The Ceylon Petroleum Corporation, Ceylon Electricity Board and SriLankan Airlines need immediate reform or sale to a private party to arrest the growing magnitude of this problem.
Previous attempts to address this problem have attracted controversy. Our general population is not prepared to allow disposal of enterprises despite their record of making large losses year after year. Apart from the macroeconomic problem, the country has a large productivity and efficiency problem that requires more resources to keep growing even at the same rate given that productivity and efficiency issues have not been addressed adequately.
Finally, there is no alternative to reform. Advocata is doing its best to convince our public of this truth. This report is the result of Advocata’s continuing effort to convince the public of the need for reform.
Dr. Sarath Rajapatirana,
Chair of the Academic Programme
Acronyms
- CCME – Cabinet Committee on Economic Management
- CEB – Ceylon Electricity Board
- CEO – Chief Executive Officer
- COPE – Committee on Public Enterprises
- CPC – Ceylon Petroleum Corporation
- FMRA – Fiscal Management Responsibility Act
- GDP – Gross Domestic Product
- GLCS – Government Linked Companies
- IMF – International Monetary Fund
- MPC – Marginal Propensity to Consume
- PED – Public Enterprise Department
- ROA – Return on Assets
- RTI – Right to Information
- SLFP – Sri Lanka Freedom Party
- SOBE – State Owned Business Enterprise
- SOE – State Owned Enterprise
- SWF – Sovereign Wealth Funds
- UK – United Kingdom
- UN – United Nations
- UNP – United National Party
Timeline of Reforms
Brief History of State Owned Enterprises in Sri Lanka
Prior to 1955
- During World War II few public sector industries were set up to maintain essential supplies.
- Among those were several factories producing various items such as cement, steel, caustic soda, food processing, textiles and paper.
- Before 1955, most state owned industrial activities operated under the Department of Industries.
- In 1955, Government sponsored Corporations Act No. 19 was introduced.
- In 1957, State Industrial Corporations Act No. 49 was passed.
- Other basic industries such as petroleum refilling, mineral sands, salt, fertilizer, tyres, flour milling
1955-1977
- In 1956, SWRD Bandaranaike government attempted industrialisation through forced import substitution policies.
- The era was marked with heavy Nationalisation Programmes, creation of large scale public enterprises and monopolies. By the mid 1970s, major socio-economic activities such as banking, insurance, transportation, electricity, petroleum distribution, large plantations were run by public enterprises.
– Bus companies were nationalised to form Ceylon Transport Board in 1958.
– The Ceylon Petroleum Corporation (CPC) and Ceylon Electricity Board (CEB) were established in the 1960s.
– The People’s Bank was established in 1961. - Business Acquisition Act of 1971 accelerated the nationalisation of private sector businesses.
- By 1970, the number of state owned industries increased to 23 and by 1974 it was 28.
- By 1974, the total capital investment in public sector industries was around Rs. 2346 million while it provided employment to around 47,525 persons.
1977-1988
- With privatisation being part of state policy in 1987 it paved way to set up legal and institutional structures to help the reform process.
- In 1987 several acts were passed to assist the commercialisation process of SOEs.
– Conversion of Government Owned Business Undertakings into Public Corporation Act No. 22.
– Conversion of Public Corporations or Government Owned Business Undertakings into Public Companies Act No. 23. - Institutional Framework was put in place to facilitate the privatisation process including:
– Presidential Commission on Privatisation.
– Public Investment Management Board.
– Commercialisation of Public Enterprises Division of the Ministry of Finance. - Transportation sector and consumer goods production were opened up for the private sector.
- Methods adopted mainly were in the form of partial divestiture, liquidation, management contracts and franchising, instead of change of ownership on a large scale.
1989-1993
- The 2nd wave of privatisation also known as Peoplisation began under President Premadasa.
- The development of the Colombo Stock Exchange (CSE) encouraged private investors.
- In 1990, Commercialisation Division on Public Enterprises was formed in Ministry of Finance and Public Investment Management Board (PME).
- In 1991, National Transport Commission was established.
- Extensive public sector reforms took place, it included partial and full divestiture of 43 commercial enterprise.
- During this process several malpractices such as politically favoured transfer of SOEs were observed.
– For instance, Kabool Lanka, a state owned fabric mill with a real value of about US$ 10 million was sold at a price of US$ 7 million. - Such malpractices resulted because of the absence of a proper institutional framework for the divestment of SOEs.
1994-2000
- As a continuation of the 2nd wave of privatisation, complex privatisation exercises were carried out in sectors such as telecommunications, airlines, and gas using the slogan “Free Market Economy with a Human Face”.
- However, it was observed that the government was a major shareholder in most of these privatisations.
- In the 1996 Telecommunications Regulatory Commission was established.
- In the 1996 Public Enterprise Reform Commission (PERC) was set up under an Act of Parliament. It was to ensure that the privatisation process took place in a structured and a transparent manner. It adopted strategies such as the sale of majority of shares to corporate investors on the basis of an open tender and competitive bidding, management contracts and employee buyouts.
- Rehabilitation of Public Enterprises legislation was enacted in 1996 it was to protect workers of failed privatisations and prevent industrial disputes.
- In 1997, Sri Lanka Telecom privatised with the collaboration of Nippon Telegraph & Telephone Corporation (NTT) of Japan.
2001-2004
- Setting up the Public Interest Programme Unit paved the way for a strong legislative framework and enforce independent regulatory institutions.
- Public Utilities Commission of Sri Lanka was established in 2002. It enforced multi-sector regulation and operated under the purview of the Public Interest Program Unit. It’s members were appointed in accordance with the Constitutional Council, to minimise the influence of partisan politics. Yet it’s scope was limited to regulating the electricity industry.
- The privatisation of Sri Lanka Insurance and Lanka Marine Services took place during this time. Yet the lack of transparency and inclusivity led to its failure.
- By this time, nearly 98 public enterprises including infrastructure related public enterprises had been privatised.
- Several other public organisations were also liquidated under the restructuring programme.
- In 2004, the Strategic Enterprise Management Agency (SEMA) and the National Council for Economic Development (NCED) were in support of the privatisation programme and to promote public-private partnerships, yet they remain almost ineffective.
2005-2014
- The United People’s Freedom Alliance claimed that privatisation of public corporations would be halted in their election manifesto.
- Re-nationalisation of major enterprises took place during this era; Sri Lankan Airlines was nationalised in 2008.
- In 2010, the Ministry of State Resources & Enterprise Development was set up
- In 2011, an expropriation law allowed the government to acquire 37 “underperforming” private enterprises.
- Revival of the Strategic Enterprise Management Agency (SEMA) took place in order to manage several SOEs in sectors such as banking, energy, transport, and plantations.
- State Resources Management Corporation (SRMC) was formed as a holding company under the Ministry of Resources and Enterprise Development.
- Re-nationalisation of Shell Gas Sri Lanka and Sri Lanka Insurance Corporation in 2009.
2015 onwards
- Key reforms in 2019 included an introduction of corporate governance mechanisms for SOEs.
– The introduction of a Statement of Corporate Intent (SCI) as a tripartite Memorandum of Understanding was signed by the respective enterprise, Iine Ministry and Ministry of Finance.
– The initiation of a regulatory framework for SOEs that provides commercial freedom while increasing the level of accountability. - Policy reforms related to consolidation of SOEs with similar objectives and those in similar stages of the value chain to reduce the government’s burden of maintaining such enterprises.
- In 2021, the government formed a company called Selandiva Investments Ltd, a fully state owned company, to manage and consolidate several high end real estate assets. It was established following the holding company models seen in Singapore and Malaysia.
Chapter 01: Sri Lanka’s Current Crisis
Sri Lanka has entered an unprecedented crisis. The government has limited options to close the wide budget deficit which is the root of the problem. The major items of expense are salaries, pensions and interest payments, which cannot be reduced easily in the short term. One of the few and feasible options available is to reduce the burden on the budget incurred from loss making state enterprises.
A widening budget deficit in 2020 led to severe concerns about Sri Lanka’s debt sustainability. A series of credit rating downgrades over the last two years has meant that the country can no longer access international capital markets to finance its imports or rollover its existing debt. The latest IMF assessment is that public debt has become unsustainable, which means Sri Lanka is not in a position to service its debt obligations. Attempts by the Monetary Authority to maintain a fixed exchange rate in the absence of sound monetary and fiscal policy has led to the erosion of Sri Lanka’s foreign exchange reserves. The resulting shortages of foreign currency have meant that Sri Lanka is not able to import its requirements, leading to shortages of necessities, inputs for businesses and rising prices. Sri Lankans are experiencing hardships, with curtailed business activity leading to lower incomes and lost jobs.
Subsidies provided to the general public by StateOwned Enterprises (SOEs), such as fuel subsidies by Ceypetco and electricity subsidies by the Ceylon Electricity Board, cost the government billions of rupees every year. Considering the woefully inadequate levels of taxation, these subsidybased losses are naturally bridged using debt. As a result, several SOEs are deeply indebted, and this indebtedness is fostered by the state ownership of banks, which lend regardless of the credit worthiness of the borrowing institution. In the past 2 years, in the absence of the ability to borrow externally, much of these deficits were financed through excessive money printing. This has now placed immense strain on the domestic banking system. Inflationary pressure is severe.
The most visible aspect of the problem is the shortage of foreign exchange because of the deficit in the current account (which occurs when imports exceed exports). When the level of aggregate demand in the economy is high, demand for all goods and services, both local and foreign will be high, which then causes import demand to be high and results in the current account deficit. The source of the “excess spending” is the government. Private individuals cannot spend more than they can earn or can borrow but a government is able to do so due to the ability to print money
Most of the Sri Lankan government’s spending has gone into salaries and pensions to maintain its growing workforce and interest payments on accumulated debt. The government has recruited 76,128 people in the last two years alone, and the public sector workforce is now 1.5 million1, including the military forces. The 52 strategic SOEs alone employ about 15.7%2 of the public sector workforce.
When people receive payments from the government they spend that money on consumption. Some of it goes to local products, others to imported products. Even when people spend on domestic products, some of them have some imported content. For example, local rice production requires imported fertiliser and chemicals. Both local consumption and import demand are driven up as a consequence. This consumption drive is problematic if increased government expenditure- which precipitated this consumption- is funded by newly printed money.
It is additionally problematic when supply (production) does not grow as fast as consumption. If the government raised taxes to pay for increased spending rather than through money printing, citizens would have reduced spending power, which offsets the increase in demand from public sector payments. Similarly, if interest rates were high it would promote saving instead of consumption, again reducing the pressure on prices of products.
On April 12th, Sri Lanka defaulted on some of its external debt- namely, its commercial and bilateral debt- including external debts owed by Sri Lankan SOEs. Therefore, SOEs are an integral part of Sri Lanka’s debt problem, and are consequently an integral part of the reform process ahead.
It is clear that the problem the country faces originates from the budget deficit, which means closing the deficit is a priority. The government cannot cut back on its interest payments or retrench workers in a hurry—this can only be done over time. Reducing the drain on the budget that arises from losses and subsidies paid to state enterprises is an important avenue that has to be explored.
CHAPTER 02: The Evolution of SOEs in Sri Lanka
2.1: Objectives of State-owned Enterprises: A Theoretical Overview
The evolving objectives of SOEs in Sri Lanka can be better understood in the context of global trends in SOEs. There are a number of reasons behind the estab lishment and operation of SOEs; the varying rationales for the creation of state owned enterprises are broken down by Gillis (1980)3 into three separate groups: 1) primarily economic motives, 2) primarily socio-political motives and 3) mixed motives.
1.Primarily Economic Reasons
i. Savings mobilisation4 rationale
In this rationale, SOEs are viewed as an attractive and viable option for capital formation through investment generation to undertake economic development. Additionally, the government has the extra benefit of avoiding administratively difficult and politically unpopular taxes that would otherwise be needed to raise public funds for such endeavours.
ii. Employment
SOEs can play an important role in job creation as well as job preservation, especially for a country in its early stages of economic development.
iii. Capital lumpiness, natural monopoly and risk
When the investment necessary to be undertaken is large, capital-intensive, and risky, such as is the case with ‘natural monopolies’, it can be financially restrictive for any other private entity other than the state to undertake.
2.Primarily Socio-political Reasons
i. The ‘Commanding heights’
It is argued in this rationale that certain sectors of the economy are so significant to the development process of the country due to their strategic position and the “linkages” they generate that they cannot be left to private investments. The state should therefore control these industries from a ‘commanding height’ to guarantee a socially responsible performance.
ii. Decolonization
Many former colonies view the presence of colonial industrial interests as an unpleasant reminder of colonial exploitation and a major impediment to development. As a result, many former colonies nationalised such foreign interests.
iii. Social goods
In this rationale, SOEs are assigned responsibilities to promote social and equity goals of society, such as income redistribution, addressing regional disparities and reducing unemployment. Such a rationale is cohesive with the development aspirations of many countries.
3.Mixed Reasons
i. Anti-concentration
Under this rationale, SOEs attempt to deal with the concentration of economic power in the hands of a few individuals or families and nationalisation of such private firms was necessary to reduce the scope of the abuse of power.
ii. Donor preference Development through support from donor agencies are common in developing countries and such lending may be contingent upon state participation as donors may not prefer to channel large amounts of resources to private entities.
Pre-independent Ceylon did not have any particular policy on state ownership in commercial activities but the circumstances of the Second World War meant that the state had no choice but to involve itself in certain activities as there was no private sector interest or capacity to do so. Starting from the mid-1950s and until 1977, Sri Lanka followed policies of self-reliance; importsubstituting domestic production in the private sector; and state-led manufacturing to accelerate industrial development.
A combination of declining trade and growth-retarding economic policies from the late 1950s resulted in low investment and slow economic growth. As a result, the economy struggled to absorb the burgeoning number of school and university leavers into productive jobs. Good health policies had contributed to longer and healthier lives, and expansion of education had generated aspirations of formal rather than informal work but the economy failed to create the necessary jobs.
This culminated in a youth insurrection in 1971 as young people who had been led to believe that increased education would bring jobs and economic prosperity found themselves disenfranchised and unemployed instead. The response of successive governments was, therefore, to create government jobs, which it could do very easily, and regardless of the actual need for such jobs, would absorb these disenfranchised youth.
“At the early stages, government owned enterprises, especially the Ports Cargo Corporation, Ceylon Transport Board and the Ceylon Government Railway, were the most notable victims of the short sighted policies of providing employment for political party loyalists. This opened the doors for large-scale political appointments, politically motivated promotions and even politically engineered dismissals of employees.”
The rationale for state enterprises has changed over time. In the early post-independence era the establishment of SOEs was driven by well-meaning, if misguided, attempts at decolonisation. The proliferation of SOEs subsequent to this, however, appears to be largely led by a desire for the state to control the commanding heights of the economy and job creation, rationale. Over the last two decades job creation, nepotism and corruption seem to have motivated state control over many sectors in the economy.
Over the years, several SOEs, particularly the Ceylon Electricity Board (CEB) and the Ceylon Petroleum Corporation (CPC), have run enormous losses and added to the government’s deficit and debt burden. With the on-going debt crisis, Sri Lanka has found itself once again at a crossroad. The government’s budget deficit is extremely high, foreign reserves are depleted, debt repayments are looming. Unsustainable state spending needs to be tackled and there is little room for further debt. Necessity dictates that the next chapter on SOEs will have to be a retreat from state involvement in the economy.
2.2: The Origins of Sri Lanka’s State-Owned Enterprises
With Sri Lanka set to head for an IMF programme for the 17th time in its post-independence history, the discussion around reforms of its state-owned enterprises is timely. SOEs play an outsized role in Sri Lanka’s economy and their inefficiencies drag overall economic growth. An understanding of the history of SOE provides a useful perspective to frame the discussion.
The emergence of SOEs in Sri Lanka can be attributed to the exigencies of the Second World War, which disrupted trade links and created scarcities in the domestic market. The government was compelled to guarantee the regular supply of essential needs for the war effort; acetic acid for the manufacture of rubber, plywood for tea chests and leather for boots and hats of soldiers.
The government wanted the private sector to take up these ventures but, despite offers of financial and technical assistance, none were willing. The problem, we now understand, was one of know-how: these were completely new ventures and lacking any knowledge in the area and, therefore, no one was willing to take the risk.
The war meant that investment from overseas—a common route to transfer of knowledge and technology—was closed. The government stepped in to fill the gap and set up factories for the manufacture of coir (1940), boots and shoes (1941), steel re-rolling (1941), plywood (1941), paper (1942), acetic acid (1942), quinine and drugs (1943), glass (1944) and ceramics
Between 1945–70 both the right and left in the UK largely subscribed to ‘Keynesian’ policies which prescribed government expenditure as a driver of economic growth. As such, at the end of the war, the colonial government appeared to be in favour of an expanded public sector. Two State Council committees advocated for this in 1946 and 1947.
The leaders of the UNP government that came into power in 1947 were drawn from landowners who were sympathetic to agriculture. This attitude, together with the scarcity of foodstuffs post-war, led the government to prioritise agriculture over industrial development. A government commission and an International Bank for Reconstruction and Development (IBRD)6, a forerunner to the World Bank, recommended that there be no state management in industrial undertakings and proposed gradual disengagement. The Government sponsored Corporations Act No.19 of 1955 was then brought into provide the legal framework for the transfer of government undertakings to the private sector.
The change of government in 1956 shifted attitude, the Sri Lanka Freedom Party’s (SLFP) 1951 manifesto declared that all essential services including large plantations, transport, banking and insurance should be progressively nationalised.
Thus, SOEs re-entered the Sri Lankan economy largely in 1956 when the government led by SWRD Bandaranaike made a conscious effort towards industrialisation. Following the then dominant thinking in development ideology, successive governments followed a policy of import substitution-led industrialisation and direct state involvement in production, trade and finance. These policies were followed up by the nationalisation of large private companies in the late-1950s: bus companies, insurance and foreign-owned companies.
This proliferation of state enterprises continued into the early 1960s and 1970s (especially during the SLFPled governments of 1960-65 and 1970-77). The 1960s saw the setting up of the Ceylon Petroleum Corporation (CPC) and Ceylon Electricity Board (CEB) (although predecessors of the CEB existed from 1926). The People’s Bank was established in 1961 and expanded rapidly. Plantations were nationalised in 1975 under provisions of the 1972 Land Reform Act, while the Business Acquisition Act of 1971 accelerated the nationalisation of private sector business activities.
All this meant a rapid expansion of the public sector. Between 1970 and 1977, there was a fivefold increase in the public sector employment while the share of GDP increased only by 3%7. Accompanying this was an increase in corruption and political patronage, especially in terms of recruitment into the state sector.
These policies gained political and social support by supporting non-financial and populist objectives; redistributive justice (Ceylon Transport Board providing cheap transport in rural uneconomical routes), regional development (paper factory in Embilipitiya), price regulation of essential products (Cooperative Wholesale Establishment providing food items at below market prices), providing employment and training. In achieving these objectives and to ensure their viability, these SOEs became virtual state monopolies in their respective sectors.
2.3: Post-1977 Liberalisation, Reform and Privatisation
Despite the open economic policies implemented under the post-1977 UNP government, no major change took place in the state’s direct involvement in production, trade and finance via SOEs. Liberalisation was largely confined to deregulation and reduction of controls.
Some trading monopolies, however, were broken. A venture in flour milling was arranged, foreign banks were permitted to operate, and bus transport was opened to the private sector. In hindsight, these were not particularly successful. Flour milling ended up replacing a public monopoly with a private one and lacking any commitment to service. Private bus services have deteriorated substantially.
The SOEs seemed to enjoy wide public support and increasing political violence put anyputative reform on the backburner. There was also no immediate pressure for reform as concessionary foreign aid provided the government with the breathing space necessary to sustain the SOEs.
The reduction in import duties that accompanied the open economic policies meant that SOEs found it difficult to compete with imported goods amidst declining productivity and efficiency. SOEs’ dependence on tariff protection and state subsidies increased, going against government policy and burdening the budget deficit.
Privatisation only became state policy in 1987, which led to the “Conversion of Government-Owned Business Unites (GOBUs) into Public Corporations Act, No. 22 of 1987” and “Conversion of Public Corporations of GOBUs into Public Companies Act, No. 23 of 1987”. This created the legal framework for privatisation.
The development of the Colombo Stock Exchange (CSE), the establishment of venture capital and unit trust funds enabled a participatory process of privatisation with 10% of shares in ventures being distributed free among employees based on length of service in the SOE. This allowed employees to benefit from privatisation. This, together with retail investor participation when SOEs were listed, ensured, to some degree, that the benefits of privatisation were more reasonably well distributed.
By 1991, budgetary support for the two plantation corporations – Janatha Estate Development Board (JEDB) and State Plantation Corporation (SPC) – amounted to Rs 1,683.7 million8 and was no longer sustainable. Poor productivity and reduced profitability lead to increased indebtedness to the state banks and the Treasury. This prompted further reform which transferred management of a majority of the estates under these two corporations to local private sector companies.
2.4: Second Wave of Privatisation in the 1990s
The 43 SOEs that were partially or fully divested between 1989 and 19939 yielded approximately $102 million in gross receipts, but these were largely ‘easy picks’ compared to the more complex service and utility sector divestitures implemented in the 1994-2000 period which yielded about $403 million in proceeds. Sri Lanka Telecom, Air Lanka and Colombo Gas Company were privatised in the latter half of the 1990s via sale of stakes to foreign investors who took over the management of these entities. However, in all these complex privatisations the government retained a major shareholding in the companies.
The execution of these privatisations, came from a strong political will to pursue complex reforms in sectors that had wider social implications, which in turn was driven by the escalating deficits created by the war situation.
Post-2000, the privatisation of Sri Lanka Insurance Corporation and Lanka Marine Services were not transparent, and unlike the previous privatisations, did not benefit either employees or retail investors. A strategy to gain political capital and public support for the process was lacking, which eventually paved the way to the reversal of ownership to the state through court action.
Regardless of the merit of the arguments made by the court, these two rulings lent credence to claims that the privatisation process involved rent-seeking and permitted private interest groups aimed to gain unfairly from the process. This provided support to the antiprivatisation lobby. Thus, the United People’s Freedom Alliance government that followed in 2005 came to power with a manifesto that opposed the reform process of the preceding governments.
Privatisation was not debated again until 2015. The new Yahapalanaya government found itself in a dilemma: Budget pressures were high and should have pushed privatisation back on the agenda, but with the pitch tainted by the previous experience it shied away from reform.
Instead of privatising, or even reducing bloated state expenditure, they resorted to taxes to cover the yawning deficit, which proved to be even more unpopular. The 2018 currency depreciation put the cost of living under further pressure while corruption scandals involving highly placed politicians and officials robbed the Yahapalanaya government of credibility.
With in-fighting between the Yahapalanaya coalition, the 2018 constitutional coup and the 2019 Easter Sunday bombings there was no political capital left to spend. The problems, although forgotten, were not gone.
2.5: State Owned Enterprises and Economic Growth
The theoretical literature remains fairly inconclusive concerning the net effect of SOEs on economic growth although a lot of empirical evidence suggests that SOEs are less efficient than their private counterparts. A study by Szarzeca, Dombi and Matuszak (2021) finds that their impact hinges crucially upon the country’s institutions: in countries with good institutions the effect of SOEs is more beneficial while in countries with bad institutions the effect of SOEs is detrimental to growth.
“We regard the institutional environment as a decisive conditioning factor of SOEs’ economic impact: the disadvantages of state-owned enterprises—such as agency problems, soft budget constraints, etc.—are more likely to be present (absent) when government institutions are bad (good), while the potential advantages of SOEs in the economy—such as the support of industrialisation, innovations and knowledge spillovers—are more likely to materialise and offset the disadvantages under good government institutions” (Szarzeca, Dombi and Matuszak, 2021).
The relationship between economic growth and SOEs may be assessed using a variety of SOE-performance related indicators. The 2021 study by Szarzec, Dombi and Matuszak10, which looked at the effect that SOEs have had on economic growth between 2010 and 2016 in 30 European countries, provides some answers. The study looked at 130,000 large, non-financial SOEs and concluded that the positive (or negative) impact the SOE has on economic growth depends significantly on the quality of the country’s institutions. They surmise that, if developing or middle-income countries are to consider relying on SOEs as an engine of economic growth, the improvement of the institutional environment is paramount. If the country fails to improve the quality of its institutional frameworks then SOEs will undoubtedly be a hindrance rather than a contributor to economic growth.
The institutional architecture in Sri Lanka is poor, which has resulted in the systemic failure in governance.The economic benefits that accrue through SOEs depend upon the efficiency of the enterprises – inefficient SOEs that provide critical services such as energy or ports can impact on the efficiency of private business and drag down overall economic growth.
The ADB, which put forward a comprehensive evaluation framework on economic performance of SOEs surmises that solvency, per capita costs, and per employee productivity have more deterministic power over the success or failure of SOEs than profitability11. The impact and desire for SOEs can depend on the country in context, for example, SOEs were perceived to be of significant importance in India post-independence and were thought to be the optimal way of achieving growth in some of the key sectors of the economy12.
Following the liberalisation of the Indian economy in 1991, it became apparent that SOEs lacked market competitiveness and efficiency compared to the private sector. However, more recently, under the Modiadministration which has set itself a target of raising $6.7 billion dollars through SOE disinvestment, prioritised the reform of loss-making and debt-ridden SOEs.
The relationship between SOEs and economic growth in Sri Lanka has not been studied but the number of SOEs in existence have proliferated over time, while economic growth has stagnated. Except for a brief post-war spurt in growth (2010-2012), which was driven by debtfinanced government infrastructure projects, economic growth, even following liberalisation in the late 1980s, has been below potential.
In the present context, the contribution to economic growth from Sri Lanka’s strategically important SOEs is dubious – they are heavily indebted, incur large losses and have contributed to large government deficits. They have directly contributed to macroeconomic instability effectively dragging economic activity down. For an example, the CPC, which imports and distributes 80%13 of the country’s petroleum, is unable to finance its import costs, and the CEB is unable to source fuel for power generation due to a lack of funding. Additionally, there have been years-long allegations 14that CEB actors deliberately quash renewable energy projects for personal gain, the lack of which has now caused energy costs to soar due to heavy dependency on imported fossil fuels which are increasing in price globally, and is compounded by a fast depreciating rupee.
CHAPTER 03
CAUSES AND
CONSEQUENCES OF SOE
UNDERPERFORMANCE
The poor performance of state
One view is that the shortcomings of the public sector are seen as organisational problems capable of being
owned enterprises has been the
solved by the appropriate application of “political will,
subject of both public and academic
powerful ideas and managerial will”. (Mutegi & Ombui,
discussion because of the impact these
2016). This, however, is too shallow a view; Mutegi & Ombui identify the root of the problem with SOEs as
have on public finances and the way
being “multiple, ambiguous and conflicting objectives”.
they are intertwined with matters of
As they point out, the government:
public policy.
“decreed that SOEs operate in a commercial, efficient and profitable manner; and at the same time insisted that they provide goods and services at prices less than cost-covering levels, serve as generators of employment, receive their inputs from state-sanctioned suppliers, choose plant location on political rather than commercial criteria, hire their staff on the basis of who they were rather they what they knew, etc. The mixing of social with commercial objectives inevitably led to political interference in operational decisions to the detriment of managerial autonomy, commercial performance, and economic efficiency.”(Mutegi & Ombui, 2016)
Mutegi & Ombui also found that “SOE managers possessed autonomy in areas where they should have been closely monitored, on most matters of financial reporting, and they generally lacked decision-making power where it was needed concerning day-to-day operational matters”.
The problem of conflicting objectives is made worse by agency costs: corruption, rent-seeking and the pursuit of personal objectives by politicians in SOEs. Agency costs are more complex in public enterprises due to the presence of two sets of agents: the management in the SOEs and the politicians who are supposed to hold them to account. Unlike private companies, where shareholders must ensure that managers act in the owner’s interests, in SOEs the population must rely on politicians who must in turn hold the management responsible. The dual agency problem means that agency costs are likely to be much higher than in the private sector; taken together with the problem of
Chapter 03: Causes and consequences of SOE underperformance
multiple objectives it presents a special challenge from a corporate governance perspective.
These inefficiencies are enabled by the absence of financial discipline that automatically arises if an organisation faces a ‘hard’ budget constraint. Activity in a loss making organisation comes to a halt when it runs out of funds to finance these activities and is unable to borrow any further. If SOEs are able to turn to the government or to state banks for financing, then even the threat of insolvency disappears, allowing businesses to run up enormous losses, even to the point of destabilising public finances and the banking system. A good case in point are the energy utilities of Sri Lanka, the CEB, the CPC and the flag carrying airline.
To sum up the reasons for under performance: 1.Conflicting objectives 2.Higher agency costs due to the complex relationship to ultimate owners, 3.The absence of financial discipline.
For example, the success of the Temasek model – Singapore’s holding company that manages SOEs – has been due to reducing the conflicts of objectives by separating the ownership and management of SOEs from the rest of government functions. Agency costs, which arise due to information asymmetries between owners and managers, have been reduced by high levels of transparency and three layers of boards that provide added oversight.
Sri Lanka Transport Board Annual Report 2015. (Colombo: Sri Lanka Transport Board, 2015)
3.1:
Conflicting objectives
A lack of clearly defined ownership and responsibilities creates a principal-agent problem, where the selfinterests of the principals, in this case the public, are different to the self-interests of the agents, in this case the government and management of the SOE. The principals in this case, the public, do not have the necessary time, skills or financial resources to monitor the agents; hence, unlike in a private entity, are not able to punish or take immediate remedial measures to fix it. Therefore, agentsthe government or SOE managers
- have an incentive to maximise their own self-interests
instead, which results in what is called an ‘agency cost’.
The full number employed by all 500+ SOEs is unknown. Consider the following statement by the chairman’s message in the annual report of the Sri Lanka Transport Board, a strategically important SOE.
“In spite of these improvements, operational losses of the SLTB increased substantially during the year, mainly due to the escalation of the wages bill as a result of new recruitments. The total revenue of the SLTB increased by 6.4 per cent to Rs. 35.8 billion in 2015. However operating expenditure increased by 14.1 per cent to Rs. 40.6 billion, resulting in an operating loss of Rs. 4.8 billion in 2015, when compared to a loss of Rs. 1.9 billion in 2014.” – Ramal Siriwardena, Chairman, Sri Lanka Transport Board
Stacking public enterprises with new recruits is especially common around election years. This problem does not occur in private enterprises as the principal and agent have similar interests, that of maximising company profits and ensuring efficiency.
SOEs are threatened as an extension of an incumbent government’s resource arsenal. Consider the following statement in the Auditor General’s report of the 2015 annual report of the Sri Lanka Rupavahini Corporation, Sri Lanka’s national television network.
The assets and personnel of the Corporation had been utilised for the promotion of one candidate and a telefilm had been produced and it had been telecasted free of charge. The loss calculated by the Corporation therefore amounted to Rs.1,064,300 and charges for the airtime had not been calculated. – Auditor General’s report, 2015 Annual Report, Sri Lanka Rupavahini Corporation
Sri Lanka Rupavahini Corporation Annual Report 2015. (Colombo 07, Sri Lanka: Sri Lanka Rupavahini Corporation, 2015)
Chapter 03: Causes and consequences of SOE underperformance
SOEs are also vital outlets for political patronage for loyalists and extended family members, more often than not, they also lack the necessary business acumen and qualifications necessary to run the SOEs they are given. Given their political affiliations, these politically appointed agents of SOEs maximise their own self interests.
Brother-in-law of ex-President Mahinda Rajapaksa, Nishantha Wickremesinghe had used privileges reserved for the head-of-state to divert an aircraft for personal use, inconveniencing passengers and causing the airline financial and reputational damage, a commission of inquiry heard. Operations Control Manager Gopitha Ranasinghe testified at a Presidential Commission of Inquiry investigating irregularities at the state-owned national carrier from 2006 to 2018.
Former Sri Lankan Chairman Nishantha Wickramasinghe, his wife and then Deputy Minister of Finance Sarath Amunugama, who had been in Singapore in January 2014, had returned to Sri Lanka on a flight diverted to save them one and a half hours of travel time, Ranasinghe said. He said that this had cost the airline money and possible reputational damage.
3.2:
Soft budget constraints
The soft budget constraint syndrome describes a situation in which a funding source, such as a bank or a government, finds it impossible to keep an enterprise to a fixed budget; that is, whenever the enterprise can extract a bigger subsidy or loan than would have been considered ex ante. Kornai (1979) demonstrated that, in centralised Eastern European economies, soft budget constraints were rife and decentralised economies in the West were far less prone to this syndrome. Soft budget constraints – the willingness of the government to intervene and bail out loss making SOEsespecially those in monopoly markets, can lead to two possible kinds of inefficiencies according to
EconomyNext. “SriLankan Airlines Ex-Chairman Used Head-of-State Privileges to Divert Aircraft for Personal Gain” economynext.com, August 8,
Maskin, Eric S. “Theories of the soft budget-constraint.” Japan and the world economy 8, no. 2 (1996): 125-133. PublicFinance.lk. “Non-Compliance with the Fiscal Management Responsibility Act Has Been a Demonstration of Irresponsibility.” publicfi nance.lk, June 29, 2021. https://publicfinance.lk/en/topics/Non-Compliance-with-the-Fiscal-Management-Responsibility-Act-Has-Been-a-Demon stration-of-Irresponsibility-1624966502. Ibid Ibid
Maskin (1994): 1) an allocative loss due to the failure of the monopoly to invest and 2) if the subsidy is financed by distortionary taxation or inflation an additional deadweight loss is incurred. The ‘softness’, or the degree of willingness of the government to impose budget constraints on such monopolies, is reflective of the absence of commitment. The government of Sri Lanka is not known for commitment to hard budget constraints. The Fiscal Management (Responsibility) Act No 03 of 2003 (FMRA) prohibits the government from incurring a budget deficit exceeding 5% of GDP from 2006 onwards. However, despite this legislative constraint, successive Sri Lankan governments have incurred budget deficits exceeding 5% of GDP since 2006 . In addition, the legislation also sets out the limits on government borrowing. According to the FMRA, central government debt cannot exceed 85% of GDP as of 2006, and by 2013 this amount should not exceed 60% of GDP. By 2013 this 60% limit was exceeded as debt reached 80%. Since 2018, central government debt has exceeded 80% of GDP, and in 2020 exceeded 100% of GDP as well, well above the limits set by the government itself. The government can circumvent these legislative limits by seeking parliamentary approval to extend such limits. Moreover, the FMRA also sets out limits on government guarantees for liabilities incurred by SOEs. Originally the FMRA set out a limit of 4.5% of GDP, but these limits have been raised 3 times subsequently. In 2021, this limit was extended to 15% of GDP. Therefore, the commitment of the government of Sri Lanka to hard budget constraints is absent. The government has, instead, increased the ‘softness’ of its budget constraints on both itself and SOEs. The government of Sri Lanka routinely provides SOEs with letters of comfort or Treasury Guarantees, which provide a level of assurance by the government that the debt obligation will ultimately be met, and banks, which are also state-owned, routinely disregard the prudence of lending to such debt-strapped institutions. In this statement by the Chairman of the SriLankan Airlines in its 2017-18 annual report, he alludes to the softness of the government budget constraint on the of SriLankan Airlines.
Chapter 03: Causes and consequences of SOE underperformance
The airline has been reporting losses since “Emirates” withdrew from managing the airline in the year 2008. The company loss for the year ended 31st March 2018 stood at LKR. 17.21 billion. The continued losses incurred by the airline had been financed through bank borrowings, secured by comfort letters issued by the Government. The balance outstanding loans amounted to US$ 704 million as at 31st March 2018. The balance sheet carried a negative equity to the extent of LKR 132 billion. Thus, when the major shareholder, the Government, which owns more than 90% of the shares of the Company, appointed the new Board, the Company was an unviable entity within the definitions set out in Sections 219 and 220 of the Companies Act. – G.S. Withanage, Chairman, SriLankan Airlines In the absence of a profit maximising motive, these soft budget constraints have led to lethargic and inefficient management of the duties entrusted upon SOE and their officials by the public. Consider the following observation made by the Auditor General in the special audit report on the rice import process of Lanka Sathosa, Sri Lanka’s largest state-owned retail chain, during 2014 and 2015. “Even though the approval of the Cabinet of Ministers No. 16/0454/723/014 dated 24 March 2016 for the payment of the loans and interest from the Treasury to the above Banks amounting to Rs.8,336,067,913 and Rs.418,335,864 respectively totalling Rs.8,754,403,777 had been received, the loans and the interest had not been paid by the Treasury up to date. At the time of maturity of the two Letters of Credit No. BTD-M 63519 and No. BTD-M 63537, totalling Rs.6,000,000,000 (US$ 45,000,000), that is 20 February 2015 only 9,813 metric tons of rice valued at Rs.591,833,640 had been imported. If action had been taken by paying attention to the market requirements of rice and the existing stocks and desisted from extending the period of the Letters of Credit, it would have been possible to refrain from obtaining a loan of Rs.5,361,911,463 from the Bank. If the period of the Letters of Credit had not been extended, the loans and interest payable to the Banks as of 09 December 2016 would have been only Rs.1,388,332,244 instead of Rs.7,661,768,655.”
SriLankan Airlines Annual Report FY2017/2018. (Katunayake: SriLankan Airlines Limited, 2018 Auditor General’s Department Final Report for Lanka Sathosa’s Import Activities in 2014 and 2015. Colombo, Sri Lanka: National Audit Office
Sri Lanka News – Newsfirst. “CEB Owes the CPC Rs. 80 Billion; CPC Chairman Hopes CEB Will Settle Dues Soon.” www.newsfirst.lk, June 20,
Advocata Institute. “SOEs Burden Budgets and Undermine National Savings – Advocata Institute.” www.research.advocata.org, August 9, 2017. https://www.research.advocata.org/sri-lankas-soes-burn-peoples-cash-burden-budgets-undermine-national-savings/. PublicFinance.lk. “Actual Liability of the Government Is More Than the Reported Debt Value.” publicfinance.lk, July 6, 2021. https://publicfi nance.lk/en/topics/Actual-Liability-of-the-Government-Is-More-Than-the-Reported-Debt-Value-1625574321.
Circular debt, in which one SOE owes another SOE, is also a major problem in the prudent budget management of SOEs. For instance, the Ceylon Electricity Board (CEB) buys petroleum from the Ceylon Petroleum Corporation (CPC), but as of June 2021 the CEB reportedly owes CPC Rs 80 billion for fuel that has been obtained to generate electricity; this sum has been overdue since March 2019 and was yet to be settled. This is not the first time this has occurred either. “CPC’s large losses in 2011 partly came from selling fuel at a loss to the CEB. The CPC in turn is effectively used by other state agencies to finance their losses, as fuel bills remain unpaid for extended periods. SriLankan Airlines and Mihin Air are notorious for delaying payments to the CPC. In 2011, in addition to selling fuel at a loss, the CPC also extended 8.8 billion rupees in credit to the CEB .” There are also instances of central government debt being converted into SOE debt to ‘hide’ the real scale of the Sri Lankan government’s debt position.
3.3:
Price controls
Successive Sri Lankan governments have maintained price controls on the prices of several essential commodities including rice, cooking gas, and fuel. SOEs and other private operators in these sectors are forced to sell at the controlled prices even if they do not adequately cover the costs incurred in the production, import or distribution of such commodities. Price controls impede the function of free market forces; price ceilings which prevent prices from exceeding a maximum, and price floors which prevent prices falling below a minimum can cause shortages and surpluses. The losses borne by the SOEs in this regard are absorbed by the central government through subsidies or direct allocations which are financed by debt. Shortages can prevent some consumers from being able to buy these essential goods, ultimately defeating the objective of the price control to begin with.
Chapter 03: Causes and consequences of SOE underperformance
Price controls, especially on utilities, exacerbate income inequality if more of the price controlled item is consumed disproportionately by the higher-income groups. If this is the case, the beneficiaries of the subsidy are essentially consumers who do not need to be provided subsidies. When the losses are borne through debt this means that eventually the government would need to impose taxes to recover these losses. If the tax regime is regressive, such as it is the case in Sri Lanka (indirect taxes outweigh direct taxes) this can further exacerbate income inequality. Take the following instance of the Ceylon Electricity Board (CEB). The CEB is the national electricity producer and one of the largest and most ‘strategically important’ SOEs in the country. The CEB reports of government imposed controls on price of electricity causing a loss of Rs 104,271 million in 2019 and Rs 60,431 million in
Although PUCSL is required legally to authorise a cost reflective electricity tariff for CEB, such has not been the case since 2014, while the Government required that several classes of consumers be continuously provided with subsidised electricity. As a result, CEB must sell electricity to consumers at a price less than the average cost of production. In addition, with no reimbursement of government mandated subsidy forthcoming during the year, CEB was forced to borrow further, costing the organisation in 2019 a staggering Rs 22.5 Billion in finance costs. It is critical to emphasise that, despite multiple attempts to strike a reasonable balance between the cost of production and the selling price, CEB was compelled to sell power at a price well below the cost of production. Management submitted multiple proposals to consider an at least Rs 1 (one) increase in tariff which would have resulted in an incremental revenue of approximately Rs 14 Billion per year – thus relieving even in small measure the State subsidy. In that context, I believe it may be prudent to share an insight to the prevailing tariff structure and its serious continued negative impact on State resources. – Mr Rakhita Jayawardena, Chairman, CEB Fuel subsidies have recently come back into public discourse due to the widely publicised news of CPC’s snowballing financial losses and debt situation. A study of 32 countries by IMF finds conclusive evidence that a large share of the benefits from fuel subsidies go to high-income household/entities rather than lowincome households, exacerbating income inequalities in countries that offer fuel subsidies to the general public .
Ceylon Electricity Board Annual Report 2019. (Colombo, Sri Lanka: Ceylon Electricity Board, 2019.) Ibid. Coady, Mr David, Valentina Flamini, and Louis Sears. The unequal benefits of fuel subsidies revisited: Evidence for developing countries. (Inter national Monetary Fund, 2015.) Ibid.
Consumer subsidies are generally determined as the differential of the full cost reflective price and the determined price. The full cost reflective price, which consists of the sum of supply cost, transportation cost, profit margins and taxation, is the total cost of the product. Kerosene has the largest subsidy cost per litre generating the subsidy amount of Rs. 7,697 Mn for the year 2019. The subsidy on Kerosene is largely misused by the heavy transport sector when the price gap between the diesel and kerosene is more. Absence of fully cost reflective pricing mechanism, the difference between sales revenue and the total cost provides the basis for estimating fuel subsidies. There are no formal budgetary provisions for financing petroleum subsidies resulting from determined prices being below cost-recovery levels, and accordingly, CPC tends to bear part of the subsidy costs by reporting heavy financial losses over the years. Consequently, CPC has to rely on bank borrowing to cover losses and meet liquidity requirements. Heavy borrowing by CPC affects the balance sheets of the state-banks and drives credit growth, and thereby complicates monetary policy operations of the Central Bank. At the same time, the government has to provide guarantees to support the CPC’s borrowings, raising the contingent liabilities of the government. Fuel prices in Sri Lanka are controlled by the government and revisions are made on an ad hoc basis. Any external shocks to fuel prices are not passed on to consumers and are instead absorbed by the state. If there is a sustained increase in international prices, the state may revise based on a variety of political factors. In 2018, the Yahapalanaya government introduced a new fuel pricing formula aimed at reducing the financial burden of fuel subsidies on public finance. However, there was significant opposition to this, directed by opposition parties which politicised the impact such a formula would have on the cost of living. After the new government took over in 2019, the fuel price formula was disbanded, and the government went back to its original method of ad hoc pricing. Now, in 2022, due to the unsustainable debt situation of SOEs and the state, the government had no option but to sell fuel at market prices, delivering a massive shock to the cost of living. An IMF study, which includes Sri Lanka, finds that the distribution of the welfare impact by income quintiles to be neutral, which means there is a leakage of the welfare benefits to higher-income groups. In this case, the fuel subsidy is regressive and not cost-efficient. A progressive fuel subsidy would see a higher share of total welfare benefit of the fuel subsidy accruing to lower-income
Chapter 03: Causes and consequences of SOE underperformance
households instead . In addition, Enders finds that Sri Lanka’s energy policy has contributed by 10% to the accumulation of public and foreign debt over the last 2 decades.
3.4:
Corruption
Corruption in Sri Lanka is endemic, accelerating in frequency over the past 2 decades. Sri Lanka ranks 102 out of 180 countries on the Corruption Perception Index published by Transparency International and its overall score has dropped over time from 40/100 in 2012 to 37/100 in 2021. Despite attempts to streamline the process of governance in the country, governance in the administration of public services in Sri Lanka remains poor and this has “led to wicked issues, including corruption, poor service delivery, poor quality of public institutions, and political interference in the implementation process”.
“SOEs with high-ranking public officials are often at the receiving end of corruption schemes. Historically, SOEs have been very much intertwined in political processes, acting as black boxes for political financing of incumbent governments. SOEs face particular corruption risks owing to their proximity to the government, their prevalence in corruption-prone sectors, and weak corporate governance practices .”
The UN estimates that corruption adds substantially to the costs of public goods and services, which leads to misallocation of scarce public resources, weakening policymaking and implementation and eroding public confidence in the government and its institutions.
Ibid. Enders, Klaus. “Debt generators: the case of energy subsidies.” In The Sustainability of Asia’s Debt: 317-341. (Edward Elgar Publishing, 2022.) Transparency.org. “2021 Corruption Perceptions Index – Explore Sri Lanka’s Results.” www.transparency.org, January 25, 2022. https://www. transparency.org/en/cpi/2021/index/lka. Ramasamy, Ramesh. “Governance and administration in Sri Lanka: trends, tensions, and prospects.” Public Administration and Policy (2020). doi: 10.1108/PAP-03-2020-0020 Anti-Corruption Module 4 Key Issues: Corruption in state-owned enterprises. “Anti-Corruption Module 4 Key Issues: Corruption in State-Owned Enterprises.” www.unodc.org. RSF. “Journalists Continue to Be Physically Attacked in Connection with Minister’s Use of Force at State TV Station in December.” rsf.org, April 7,
GAN Integrity. “Corruption in Sri Lanka | Sri Lanka Corruption Report & Profile.” www.ganintegrity.com, August 5, 2020. https://www.ganinteg rity.com/portal/country-profiles/sri-lanka/
Corruption can manifest itself in a variety of ways: patronage, bribes, kickbacks, manipulation, interference etc. The following is an incident in which SOE employees were threatened by a member of the government for carrying out their duties. The proliferation of such instances makes it harder for employees of SOEs to deny requests of elected officials, and corruption ensues.
Reporters Without Borders condemns two physical attacks on journalists on 27 February that seem to be linked to their coverage of a December incident in which labour minister Mervyn Silva stormed into the Sri Lanka Rupavahini Corporation (SLRC), a state-owned television station, and assaulted its news director. […] Silva, a controversial minister known for his hostility towards journalists, burst into SLRC headquarters on 27 December and ordered the thugs accompanying him to beat the station’s news director, T.M.G. Chandrasekara. Since then, journalists who helped force Silva to leave the building or who covered the incident have been targeted. Silva’s thugs are suspected of carrying out a knife attack on 25 January on SLRC journalist Lal Hemantha Mawalage, who was hospitalised with multiple wounds to the hands and body. According to the Free Media Movement, a local organisation, around 20 SLRC journalists have been questioned since the December incident but no one has been arrested or questioned in connection with the attacks and threats against journalists.
Corruption in government procurement practices is another significant issue in the management of SOEs in Sri Lanka. GAN Integrity categorises the risk of corruption in public procurement practices in Sri Lanka to be ‘high’. “Companies report that irregular payments and bribes in the process of awarding government contracts are common (GCR 2015-2016). Some claim the level of corruption makes it difficult to compete with bidders not subject to the US Foreign Corrupt Practices Act (ICS 2017).”
CHAPTER 04
SOE DEBT
4.1:
State Owned Enterprise Debt
SOEs heavily rely on lending from state banks and other foreign or domestic sources. These lending facilities extended to SOEs are often backed by treasury guarantees or subsidised by the government. The lack of financial discipline of SOEs is reflected in their excessive debt accumulation which has necessitated the restructuring of debt obligations to state owned banks and the government. SOE borrowings have been a significant component of public sector borrowing in the past few years in Sri Lanka. In 2021, total debts owed by non-financial public corporations stood at 10.9% of the GDP of Sri Lanka – LKR 1.8 trillion . The main components of SOE debt are public-guaranteed debt and the outstanding balance of foreign project loans received by SOBEs without public guarantee – the latter accounting for approximately LKR 311 billion as of 2021.
SOE Debt
Rs. Million 2,000,000 10.9 8.8 8.1 1,500,000 7.5 7.2 6.9 1,000,000
500,000
SOE debt as a % of GDP SOE debt Source: CBSL Annual Reports (2016-2021)
Figure 2
Central Bank of Sri Lanka Annual Report 2021. (Colombo 01, Sri Lanka: Central Bank of Sri Lanka, 2022.) An external obligation of an entity which is guaranteed for repayment by the government is known as public guaranteed debt. For example, if a loss-making state-owned enterprise is not able to service its debt, the burden ultimately falls on the central government because such debt is publicly guaranteed. Central Bank of Sri Lanka Annual Report 2021. Colombo 01: Central Bank of Sri Lanka, 2022, 177-204. Verité Research (2021). Navigating Sri Lanka’s Debt: Better reporting can help – a case study on China debt. Colombo: Verité Research: 6-7. Ibid., 5.
Public guaranteed debt, as cited in the CBSL Annual Report, is the debt of non-financial public corporations, which includes outstanding international bonds issued by SOEs. However, it excludes outstanding treasury bonds issued for restructuring SOEs such as CPC .
Public Guaranteed Debt Analysis Rs. Million 7.76 2,000,000 6.00 5.93 5.50 1,500,0005.22
1,000,000
500,000
Public guaranteed debt Public guaranteed debt as a % of public debt Source: CBSL Annual Reports (2017-2021)
Figure 3
Public guaranteed debt in 2017 stood at LKR 590 billion, or 5.22% of total public debt in Sri Lanka. Within the last five years, public guaranteed debt has increased by LKR 916 billion and totaled LKR 1.5 trillion in 2021, an increase of 155%. It is important to consider SOE debts (and particularly public guaranteed SOE debt) as a component of total public debt. The government has, in the past, transferred debt from the central government balance sheets to that of SOEs and vice versa. This is particularly true in the case of Sri Lanka’s external debt stock – the majority of Sri Lanka’s debt to Chinese lenders (approximately 60% as of December 2019), for example, is owed by SOEs and is therefore not reported in total central government external debt.
Chapter 04: SOE debt
Six Main Contributors to Public Guaranteed Debt
LKR1.5 Trillion
Public Guaranteed Debt
LKR
LKR BillionBillion Ceylon Petroleum Road Development CorporationAuthority
LKR
LKR BillionBillion National Water Supply Airport and Aviation and Drainage BoardServices (Sri Lanka) Ltd
LKR
LKR BillionBillion Ceylon Electricity SriLankan Airlines Board
Source: CBSL Annual Report 2021
Figure 4
The 6 main contributors to escalating public guaranteed debt as of 2021 are the Ceylon Petroleum Corporation, Road Development Authority, National Water Supply and Drainage Board, Airport And Aviation Services (Sri Lanka) Ltd, Ceylon Electricity Board and SriLankan Airlines.
4.2:
External Debt and Sri Lanka
External debt has become a critical factor in Sri Lanka’s debt management discussion. In April 2022, Sri Lanka halted its external debt repayments amidst depleting gross official reserves. Credit rating agencies had downgraded Sri Lanka in 2021 due to a lack of debt sustainability, leading to diminished investor confidence. This reduced access to credit markets and hence
Central Bank of Sri Lanka Annual Report 2020, 2019, 2018. (Colombo 01, Sri Lanka: Central Bank of Sri Lanka, 2022.) EconomyNext. “SriLankan Airlines to Restructure US$680mn in Debt, Slashing Costs to Survive after Covid-19.” economynext.com, June 22,
SriLankan Airlines Annual Report FY2020/2021. (Katunayake: SriLankan Airlines Limited, 2021.)
hindered the foreign borrowings of the government. Even though external debt owed by SOEs show a reducing trend since 2014, Sri Lanka still has to pay nearly 1.6 billion US dollars in 2022 to service this debt. This is despite having insufficient foreign currency reserves to import fuel, gas and other essential items.
External Debt of SOEs in US$ million
2,630 2,423 2,303 2,242 2,256 2,070 1,904 1,766 1,646
Source: CBSL Annual Reports (2015-2021)
Figure 5
Box Article 1
External Debt and SriLankan Airlines Large SOEs such as SriLankan Airlines have borrowed by obtaining dollar denominated debt which further deepened the public debt account of Sri Lanka. An international bond amounting to US$175 million was issued by SriLankan Airlines in June 2014; when it matured in 2019, another bond was reissued to rollover the same amount for five years. Furthermore, it is stated that SriLankan Airlines is liable for US$220 million to the Bank of Ceylon and US$187 million to People’s Bank . The heavy dependence on foreign currency liabilities has adversely affected the net losses of SriLankan Airlines in the year 2020/21. According to the SriLankan Airlines Annual Report 2020/21, the depreciation of the Sri Lankan rupee resulted in a loss of LKR 19,673 million .
Chapter 04: SOE debt
4.3:
Effect of SOE Debt on Banking Sector
The build-up of SOE debt has led to high domestic bank exposure to Sri Lankan SOEs. Of the total LKR 1.8 trillion Treasury-guaranteed debt, Sri Lankan banks (both stateowned and private) have an exposure of LKR 1.3 trillion worth of debt; this outstanding credit is mainly owed to the state-owned banks – Bank of Ceylon (LKR 566 billion), People’s Bank (LKR 96 billion), National Savings Bank (LKR 209 billion), and Sri Lanka Savings Bank Limited (LKR 60 million). Treasury guarantees are a written assurance that, in the event that an SOE is unable to repay its debts, the Treasury (i.e. the government) will meet that obligation. There is no direct cash outflow when such a guarantee is made; therefore, the government can support loans made to SOEs without directly allocating the cash in the
Outstanding Debt to Banks (Rs.Million)
Source: Ministry of Finance Annual Report 2021
Ceylon Electricity Board
224,534 Ceylon Petroleum Corporation
338,241 Sri Lanka Ports Authority
12,916 State Engineering Corporation State Development & Construction Corporation Milco (Pvt) Ltd
1,418 National Livestock Development Board
Table 1
Ministry of Finance Annual Report 2021. (Colombo 01, Sri Lanka: Ministry of Finance, 2021.) KPMG Sri Lanka Banking Report. (Colombo 03, Sri Lanka: KPMG Sri Lanka, 2021): 30.
budget. Treasury guarantees are necessary for SOEs to borrow money when they cannot borrow on commercial terms due to their poor financial position. The large losses made by the state funded enterprises are sourced mainly through state-run banks. Several large SOEs owe millions of rupees as debt to banks; the major contributors to bank debt are Ceylon Petroleum Corporation and Ceylon Electricity Board. This also adds to the circular debt problem, as explained below. However, there is a potential risk to the banking sector if both the SOE and the government are unable to meet their obligations due to the size of the accumulated treasury guarantees. Of the LKR 1.8 trillion in treasury guarantees issued for SOEs, LKR 1.5 trillion are outstanding as of December 2021. For context, the total assets of the Sri Lankan banking sector (as of December
- are LKR 14.7 trillion.
288,606
333,245
363,219
363,196 562,457
566,225
529,187
693,040 12,884
10,990
9,322
7,355 2,121
2,030
2,130
2,130 1,497
1,680
1,854
1,989 1,657
1,678
Chapter 04: SOE debt
4.4:
Circular Debt
Circular debt is created when two entities owe debts to each other, but cannot settle these debts as they are owed indirectly through various middlemen. This causes a situation where multiple entities act as both creditors and debtors and owe money to each other.
Circular debt occurs due to a shortage of liquidity, as the various entities are unable to manage their cash flows sustainably. The problem compounds when one of the entities is unable to make payments to its suppliers and creditors, and thus the problem affects the other stakeholders in a domino effect.
Box Article 2
The effects of circular debt can be seen in the electricity sectors of Sri Lanka and Pakistan.
Pakistan
“Circular debt” is a concept that originates from the debt-ridden Pakistani energy sector; the entities in this example are the government, the suppliers of primary energy (oil/gas exploration companies, gas distributors, and oil refineries), power generation and distribution companies, and consumers.
The state-owned Pakistan Electric Power Company (PEPCO) is the most significant entity in this sector and manages a number of generation (90% of generation capacity) and distribution companies and the transmission company. Most of the circular debt issues arise from PEPCO’s cash flow issues. From 2003-2007, the government, unwilling to raise tariffs to the cost-reflective levels determined by the National Electric and Power Regulatory Authority (NEPRA), created a situation where end-consumer tariffs were not able to
Ali, Syed Sajid, and Sadia Badar. “Dynamics of Circular Debt in Pakistan and Its Resolution.” Lahore Journal of Economics 15 (2010): 62-63. Ibid. Ibid., 66-67. bid. bid., 71. Ibid., 71-72. Ibid. Annual Report of the Ministry of Finance 2021. (Colombo 01, Sri Lanka: Ministry of Finance, 2022.)
fully meet PEPCO’s rising cost of generation. As the government did not fully compensate PEPCO for these losses, PEPCO’s losses started to build-up, straining cash flows. These losses were worsened as both individuals and government departments either delayed or did not pay their dues to the company. PEPCO was hence unable to pay its suppliers in a timely manner and both PEPCO and companies up the distribution chain started to build up debts to each other and the banks, eventually leading to a shortage in supply due to non-payment.
The solution to this would be to increase electricity tariffs, which was done from 20092011 and monthly adjustments were allowed thereafter . However, the government is unwilling to completely remove subsidies due to political concerns and due to the risk that, as the tariffs are raised further, more consumers will simply stop paying for the electricity they consume causing PEPCO’s revenue to decline. As a result of this, the threat of circular debt still remains.
Sri Lanka
A similar situation is visible in Sri Lanka’s energy sector. Controlled prices prevent the stateowned CPC and CEB from pricing fuel products and electricity (respectively) in a cost-reflective manner. The CPC, for example, provides fuel to end-consumers – including public enterprises (e.g. CEB, SriLankan Airlines) – at a heavily subsidised rate as consumer fuel prices do not rise sufficiently to match the price of global energy. The losses that it makes are financed through treasury-guaranteed borrowings from state-owned banks, private banks, suppliers, and international lenders. In 2021, CPC alone had losses of LKR 82.2 billion. As of 2021, it also had total outstanding debt to banks of LKR 693 billion.
Chapter 04: SOE debt
However, these losses have mounted and CPC is unable to find rupees to pay these loans, as well as its suppliers. Despite a 24.3% price increase in May 2022, CPC is still making losses
The economic consequences of circular debt can be severe. For example, if the circular debt involves a public utility (such as, Sri Lanka’s CEB and CPC), it can contribute to supply-side constraints. The inability of these utilities to provide their respective products will make it more difficult for businesses to function and may hence reduce the potential GDP of a nation.
4.5:
Reform Recommendations
Restructuring and reforming Sri Lanka’s SOEs will be a lengthy process. The reforms should be considered both in an immediate context and a consistent, long-term context.
A medium term policy solution would consist of restructuring and disinvestment, and (where possible) privatisation and listing on the Colombo Stock Exchange (CSE). A main policy undertaken when reforming SOEs is to reduce subsidies and increase efficiency, thereby forcing SOEs to compete more equitably with private enterprises. Alternatively, full or partial privatisation is a possible solution: SLT Mobitel’s service has markedly improved following the entrance of competitors such as Dialog Axiata and its 1997 privatisation; all firms in the market are held accountable by the competent Telecommunications Regulatory Commission. Listing on the CSE would allow these firms to have broad-based direct ownership while also improving the growth of the CSE and capital markets. Importantly, these firms would have to be ‘corporatised’ before listing, an opportunity to improve productivity and eliminate bloat.
NDTV.com. “In Crisis-Hit Sri Lanka, Petrol Now Costs Rupees 420 A Litre, Diesel 400.” www.ndtv.com, May 24, 2022. https://www.ndtv.com/ world-news/in-crisis-hit-sri-lanka-petrol-at-rs-420-a-litre-diesel-at-rs-400-3003669. Ali, Syed Sajid, and Sadia Badar. “Dynamics of Circular Debt in Pakistan and Its Resolution.” Lahore Journal of Economics 15 (2010): 62. Ibid PublicFinance.lk. “SriLankan Airlines: Annual and Accumulated Loss to the Public.” publicfinance.lk, August 24, 2021. https://publicfinance.lk/ en/topics/Sri-Lankan-Airlines:-Annual-and-Accumulated-Loss-to-the-Public-1629789830. India Today. “Explained: What Happens after Air India’s Handover to Tata Group.” www.indiatoday.in, January 25, 2022. https://www.indiato day.in/business/story/explained-air-india-handover-government-to-tata-group-changes-1904217-2022-01-25. Saito, Yoshitaka et al, Master Plan Study on the Development of Power Generation and Transmission System in Sri Lanka. Colombo 02, Sri Lanka: Japan International Cooperation Agency Economic Development Department, 2006.
Further, the disclosure requirements of the CSE will force transparency, accountability, and good corporate governance.
There are, however, firms that will essentially have to be given away due to their huge debts and poor reputations, as it is necessary to immediately stem losses. A prime example of this is SriLankan Airlines, which has racked up Rs. 316 billion in losses since control was taken back from Emirates in 2008. Sri Lanka would not be alone in taking such a pragmatic step to improve government finances and customer experience; Air India, the Indian national carrier, has been sold to the Tata Group for the relatively small sum of INR 18,000 crore . This would also inspire confidence amongst foriegn investors as it would show Sri Lanka’s commitment to meeting its upcoming debt servicing obligations.
Furthermore, long term solutions include strengthening governance/limiting corruption and influence, improving efficiency and restructuring, enacting cost-reflective pricing, and unbundling key sectors, and (where possible) opening up to competition. This applies particularly to firms like the Ceylon Electricity Board which, as a natural monopoly, cannot be broken up and wholly privatised without losing efficiency (the transmission network is a natural monopoly). Following a 2000 unbundling, the CEB is structured under six internal divisions – one for generation, one for transmission, and four for distribution. Although this unbundling reform did introduce a single-buyer model, it did not require the CEB’s subdivisions to be spun off. A 2006 study by the Japan International Cooperation Agency recommended breaking up CEB into three parts: “making the generation, transmission, and distribution divisions…independent ”. The Asian Development Bank similarly said that “the CEB generation, transmission, and distribution licensees need to be corporatized… to enable independent decision making and to secure the full benefits of the tariff methodology that…is currently fraught with delays, government interference, and weaknesses. ” These six newly separate entities could be run independently of each other, under an
Assessment of power sector reforms in Sri Lanka: Country report. (Mandaluyong City, Philippines: Asian Development Bank, 2015): 60.
Chapter 04: SOE debt
organisational structure where they report to a CEB holding company, and privatised if necessary. Certain segments of the CEB (such as power production and end user distribution) can be opened up to competition
- for example by transferring IPP (independent power
producer) power plants to the private sector once their existing agreements expire. However, these reforms (and other market-based reforms) can only take place following substantial strengthening of industry regulator PUCSL, which the ADB describes as a “weak regulator that is unable to enforce reforms or manage the industry information efficiently, and lacks experience with implementing benchmark competition ”.
Cost-reflective pricing is another essential reform. The existing system of having electricity tariffs priced below cost is a public subsidy whose cost will be borne by future generations. It is also inequitable, as the government could provide low cost services to those who need it by giving them direct cash transfers, instead of subsidising the wealthy who can afford to pay. In 2021, total losses of all loss making SOEs amounted to 73.92% of health expenditure, 92.13% of education expenditure, or 516.55% of expenditure on Samurdhi
- the national cash transfer system to low income
earners.. A similar situation is evident with the Ceylon Petroleum Corporation, which currently makes a loss of LKR 84-295 per litre of fuel ; again, a public subsidy to those who can often afford to pay the market price. Cost-reflective pricing in particular may aid in eliminating the cycle of circular debt – but needs to be employed in conjunction with other reforms to be effective. Finally, greater accountability, by means of annual internal audits and the availability of SOEs’ financial information to the public, is also important to ensure these firms stick to the targets they are given.
Ibid., 58. Ibid. Ibid., 60. Advocata Database EconomyNext. “Sri Lanka PM Says CPC Still Incurs Losses despite Fuel Price Hike” economynext.com, May 17, 2022. https://economynext.com/ sri-lanka-pm-says-cpc-still-incurs-losses-despite-fuel-price-hike-94321/.
CHAPTER 05
MEASURING
SOE PERFORMANCE
Please refer to Advocata’s www.soe.lk web platform for the most up-to-date analysis of Sri Lanka’s State Owned Enterprises.
5.1:
A scorecard for SOEs
Sri Lanka has a total of 527 State Owned Enterprises out of which regular information is only available for 52. These SOEs accumulate billions of losses annually due to mismanagement, fraud, corruption and negligence. Despite these malpractices, one of the most concerning systemic issues engulfing SOEs is the lack of information. Even obtaining a complete list of entities proved to be a challenge. This lack of information is evident considering that in 2020, 46 of the 52 strategic SOEs didn’t publish annual reports while the Public Enterprise Department, the main governing body of SOEs, has not published annual performance reports since 2018. Furthermore, given that total credit directed to the 52 SOEs by banks was close to LKR 920 billion in 2020 and Treasury support given to SOEs was at LKR 75 billion , the general public (the principal) deserves transparency in how these funds were utilised. The lack of crucial information makes it almost impossible to track SOE performances and to hold them accountable. This lack of accountability encourages the lack of discipline in governance and obviously creates a massive burden to the economy. Therefore, the research team of Advocata aimed to address this fundamental issue by conducting a comprehensive analysis into the financial and the governance indicators of SOEs from 2015 to 2020 and then converting the research into a comprehensible tool which can be used to advocate for SOE Reforms. This research has been made publicly accessible on Advocata’s new platform – www.soe.lk. The SOE scorecard and other relevant information can be obtained on this platform.
Dissanayake, Imesha, “SOE Reforms; the Impetus for Post Pandemic Economic Revival” (Colombo, Sri Lanka: Economic Intelligence Unit (EIU) of the Ceylon Chamber of Commerce, 2021).
5.2:
Methodology for Financial and
Governance Indicators
The scorecard method is a widely used technique for performance management evaluations. There is strong evidence that a scorecard helps improve profitability and provides guidance for management tasks, while identifying the problems impacting performance. Advocata’s scorecard on State-Owned Enterprises (SOEs) is a measurement of performance from both a financial and governance perspective.
Information on specific indicators pertaining to SOEs was collected to analyse the Financial and Governance performance of these entities. The selected financial and governance indicators were based on the criteria “relevant, results-driven, rectifiable” to effectively signal performance of the 52 strategic SOEs.
Information for the sub-indicators for financial and governance indicators was sourced as follows. Financial information was sourced using Annual Reports, Treasury Reports and Department of Public Enterprises (PED) Reports from 2015 to 2020. Governance information was sourced using Annual Reports, Auditor General’s Reports, and responses to Right to Information requests filed by Advocata and other content from the SOE websites.
The selected indicators are: Financial
- Turnover
- Profit/Loss
- Total Assets
- Total Liabilities
- Total Equity
- Return on Assets
Chapter 05: Measuring SOE performance
Governance
- Annual Reports
·· Year of the most recent Annual Report available online ·· Have the Annual Reports for the last five years been tabled in Parliament? ·· Does the Annual Report include the mandatory provisions set out in the PED guidelines?
- Auditing Standards
·· Is the Audit Clean/ Qualified/ Disclaimer?
- Right to Information
·· Is the information pertaining to the RTI officer available on the website? ·· Does the SOE respond to an RTI within the timeframe specified in the Act?
- Accessibility of Information.
·· Does the SOE have a website? ·· Does the SOE website contain sufficient organisational details? ·· Does the SOE website contain tender and procurement details?
The scorecard technique is a widely used technique for performance management evaluations in the present day. It is considered that a scorecard helps in improving profitability and providing guidance for management tasks while identifying the problems affecting performance. Advocata’s scorecard on State-Owned Enterprises is a measurement of performance through both a financial and governance perspective.
5.3:
Limitations
- Infrequent or unavailable SOE annual reports. Most
SOEs do not have annual reports uploaded onto their websites. The information had to be extracted from other sources, such as the Parliamentary website, Treasury Reports, and PED Reports. For example, in the case of the Lanka Sugar Company, no annual reports are available online (http://www. lankasugar.lk/index.php/2-uncategorised). Further, some annual reports do not include key provisions such as performance reports, impacting the data collection of non-financial indicators. In addition, even if available, these annual reports are often not aggregated in the same location within the SOE’s website.
- Data disparities between different government
reports. There were frequent inconsistencies between numerical values given in an annual report of a particular SOE and the values given in the PED or Treasury reports. In such instances, priority was given to annual reports of the SOEs to fill in information on the Indicators.
- Failure to align non-financial indicators to
international good practice. The international literature (for example, OECD and World Bank materials on corporate governance for SOEs) recommends including Key Performance Indicators (KPIs) (for example, whether SOEs use KPIs to make decisions on Directors’ remuneration, hiring and firing, etc.). However, the SOE annual reports did not provide clarity as to whether such processes were in place.
- Limitations on the Return on Assets (ROA) ratio.
The ROA ratio was employed as the sole financial indicator used to rank SOEs from best to worst performing. However, it is important to note that while this ranking considers how efficiently assets are managed in the pursuit of profits, it does not reflect differences in the nature of business operations across industries.
- Lack of data and information about financial
performance. In many instances, the financial performance of SOEs was not known due to unavailability and incompleteness of financial statements. PED Annual Reports, which include information on SOE debt exposure, are not available from 2018.
Chapter 05: Measuring SOE performance
5.4:
Analysis of Governance Indicators
5.4.1: Methodology of Governance Indicators
Phase I As mentioned above, four main governance indicators were selected to evaluate the 52 SOEs. Sub-indicators were used to get a detailed perspective on governance practices in these SOEs.
Phase II An expert committee decided on justifications for all main indicators and sub-indicators (see the Annexure). A coding scheme of “green, amber, red” was used to grade the sub-indicators, representing good, average, and poor respectively, with with each colour assigned a specific weight (see Figure 6).
Good
Average
0.5
Poor
Figure 6 Phase III A weighted average score was calculated for each SOE by allocating equal weights to each main indicator. Each sub-indicator was given equal weight based on the number of sub-indicators under the main indicator. For example, the main indicator “Annual Report” was given a weight of 25 percent; it had 3 sub-indicatorseach received a weight of 8.33 percent (see Figure 7).
Annual Report – 25%
Year of the
Have Annual
Does the most recent
Reports for
Annual Report Annual Report the last five
include the available
years been
mandatory online
tabled in
provisions set Parliament?
out in the PED guidelines?
8.33
8.33
8.33
Figure 7
Phase IV Weighted average scores for all main indicators were summed up to calculate a composite score for each SOE. To further analyse the spread of distribution of the 52 SOEs, quartiles were defined as follows,
0%- 25%
4.2 – 29.2
Total Failure
25%-50%
29.2 – 45.8
Unsuccessful
50% – 75%45.8 – 58.3
Marginally Successful
75% – 100%58.3 – 91.7
Successful
Figure 8
Chapter 05: Measuring SOE performance
Scorecard for SOE Governance Indicators
State Owned Enterprises
Banking and Finance Bank of Ceylon People’s Bank National Savings Bank (NSB) State Mortgage & Investment Bank (SMIB) Housing Development Finance Corporation Bank (HDFC) Pradeshiya Sanwardhana Bank (RDB) Employees’ Trust Fund Board
Insurance Sri Lanka Insurance Corporation National Insurance Trust Fund Sri Lanka Export Credit Insurance Corporation Agricultural and Agrarian Insurance Board
Energy Ceylon Electricity Board Ceylon Petroleum Corporation
Ports Sri Lanka Ports Authority
Water National Water Supply and Drainage Board
Aviation Airport and Aviation Services (SL )Ltd SriLankan Airlines Ltd
Transport Sri Lanka Transport Board
Construction State Engineering Corporation of Sri Lanka Central Engineering Consultancy Bureau State Development and Construction Corp.
Livestock Milco Ltd National Livestock Development Board
Annual Report Year of the most
Have Annual
Does the Annual recent Annual
Reports for the
Report include Report available
last five years
the mandatory online
been tabled in provisions set out in Parliament?
the PED guidelines?
Partially
Yes Partially
Yes Yes
Yes Partially
Yes Partially
Yes Partially
Yes Partially
Yes
Partially
Yes Partially
Yes Partially
Partially Partially
Partially
Partially
Yes Partially
Yes
Partially
Partially
Partially
Partially
Partially
Yes Partially
Yes
Partially
Partially
No
Partially Partially
Partially No
Partially
Partially
Partially No
Partially
Chapter 05: Measuring SOE performance
Auditing Standards
Right to Information Is the Audit
Is the information
Does the SOE Clean/Qualified/
pertaining to the
respond to an Disclaimer?
RTI officer available
RTI within the on the website?timeframe specified in the Act?
Unqualified
Yes
No Unqualified
No
Yes Unqualified
Yes
No Unqualified
No
No Unqualified
No
No Unqualified
No
No Qualified
No
No
Qualified
No
No Qualified
No
No Unqualified
No
No Qualified
No
No
Qualified
No
Yes Qualified
Yes
Yes
Disclaimer
Yes
No
Qualified
Yes
Yes
Qualified
Yes
Yes Unqualified
Yes
Yes
Disclaimer
No
No
Qualified
No
No Qualified
No
No Qualified
No
No
Disclaimer
No
No Disclaimer
No
No
Accessibility of Information Does the SOE have
Does the SOE
Does the SOE a website?
website contain
website contain sufficient
tender and organtisational
procurement details?
details?
Yes
Yes
Yes Yes
Yes
Yes Yes
Yes
No Yes
Partially
Yes Yes
Yes
No Yes
Yes
Yes Yes
Partially
Yes
Yes
Yes
Yes Yes
Partially
No Yes
Partially
Yes No
No
No
Yes
Partially
Yes Yes
Partially
Yes
Yes
Partially
Yes
Yes
Partially
Yes
Yes
Yes
Yes Yes
Partially
Yes
Yes
Partially
Yes
Yes
No
No Yes
Partially
Yes Yes
Partially
No
Table 2
Yes
No
No Yes
No
No
Table 2
Chapter 05: Measuring SOE performance
Scorecard for SOE Governance Indicators
State Owned Enterprises
Plantation Sri Lanka State Plantations Corporation Janatha Estates Development Board Kurunegala Plantations Ltd Chilaw Plantations Ltd Kalubovitiyana Tea Factory Ltd Sri Lanka Cashew Corporation
Non-renewabale resources Lanka Mineral Sands Ltd Lanka Phosphate Ltd Kahatagaha Graphite Lanka Ltd
Lotteries Development Lotteries Board National Lotteries Board
Health State Pharmaceuticals Manufacturing Corp. SL Ayurvedic Drugs Corporation State Pharmaceuticals Corporation Sri Jayawardenapura General Hospital
Media Independent Television Network Ltd SL Rupavahini Corporation Sri Lanka Broadcasting Corporation
Other Sri Lanka Handicraft Board State Timber Corporation STC General Trading Company Lanka Sathosa Ltd State Printing Corporation Ceylon Fisheries Corporation Ceylon Fishery Harbour Corporation Ceylon Fertilizer Company Ltd Colombo Commercial Fertilizer Company Ltd Hotel Developers Lanka PLC Lanka Sugar Company Ltd
Annual Report Year of the most
Have Annual
Does the Annual recent Annual
Reports for the
Report include Report available
last five years
the mandatory online
been tabled in provisions set out in Parliament?
the PED guidelines?
No
Partially No
Partially Partially
Partially Partially
Partially Partially
Partially Partially
Partially
No
Partially Partially
Partially Partially
Partially
Partially
Yes Partially
Partially
Partially
Partially Partially
Partially Partially
Partially Partially
Partially
No
Partially Partially
Partially Partially
Partially
No
Partially Partially
Yes 2018/2019
Partially
Partially Partially
Partially No
Partially No
Partially Partially
Partially Partially
Yes Partially
Partially No
Yes N/A
N/A
N/A
Chapter 05: Measuring SOE performance
Auditing Standards
Right to Information Is the Audit
Is the information
Does the SOE Clean/Qualified/
pertaining to the
respond to an Disclaimer?
RTI officer available
RTI within the on the website?timeframe specified in the Act?
Disclaimer
No
No Disclaimer
No
No Qualified
No
No Qualified
No
No Qualified
No
No Qualified
No
No
Qualified
No
No Unqualified
No
No Unqualified
No
No
Qualified
No
Yes Qualified
No
No
Qualified
No
No Disclaimer
No
No Qualified
No
No Disclaimer
No
No
Qualified
No
No Unqualified
No
No Disclaimer
No
No
Disclaimer
No
No Qualified
No
No Unqualified
No
No Disclaimer
No
No Qualified
No
No Qualified
No
No Disclaimer
Yes
No Qualified
Yes
No Qualified
Yes
No Unqualified
No
No N/A
No
No
Accessibility of Information Does the SOE have
Does the SOE
Does the SOE a website?
website contain
website contain sufficient
tender and organtisational
procurement details?
details?
Yes
Partially
No Yes
Partially
No Yes
Partially
Yes Yes
Partially
No Yes
Partially
Yes Yes
Partially
No
Yes
Partially
No Yes
Yes
No Yes
Partially
Yes
Yes
Partially
Yes Yes
Partially
Yes
Yes
Partially
Yes Yes
Partially
Yes Yes
Partially
Yes Yes
Partially
No
Yes
Partially
Yes Yes
Partially
Yes Yes
No
No
No
No
No Yes
Partially
Yes Yes
Partially
Yes Yes
Partially
Yes Yes
Partially
No Yes
Partially
No Yes
Partially
Yes Yes
Partially
Yes Yes
Partially
No Yes
Partially
No Yes
Partially
Yes
Table 2
Chapter 05: Measuring SOE performance
Analysis on Governance Indicators
Annual Reports
Financial and non-financial information of an SOE are disclosed to the general public through annual reports. Enterprises which are maintained by state funds should be transparent. As per the OECD, Annual Reports should be tabled at the parliament for evaluation; for the media to raise awareness on the efficiency of the SOE; and for taxpayers and the general public to get an understanding on the performance of SOEs. Annual Reports of SOEs were evaluated using three sub indicators, Year of the most recent Annual Report available online Have the Annual Reports for the last five years been tabled in Parliament? Does the Annual Report include the mandatory provisions set out in the PED guidelines? Based on how the SOE complied with the justification for each sub indicator it was colour-coded in green, amber or red. As a second step, the weighted average score was calculated for each sub indicator. The score for the main indicator was calculated by adding up the weighted averages of all three sub indicators. Based on the score of the main indicator Annual Reports the SOEs were ranked as below. Among the best performing SOEs for Annual Reports are many of the state banks, which are subjected to strict regulatory and supervisory framework.
Disclosure and transparency | Implementing the OECD Guidelines on Corporate Governance of State-Owned Enterprises: Review of Recent Developments | OECD iLibrary. “Home.” www.oecd-ilibrary.org, January 1, 1887. https://www.oecd-ilibrary.org//sites/4b068880-en/index.htm l?itemId=/content/component/4b068880-en#. Justification for all the indicators are mentioned in the annexure.
WORST SOEs
TOP SOEs
1.Lanka Sugar
1.National Savings Company (0)
Bank (25) 2.State Fisheries
2.Bank of Ceylon (20.8) Corporation (4.2) 3.People’s Bank (20.8) 3.State Printing 4.HDFC Bank (20.8) Corporation (4.2) 5.Regional Development 4.Sri Lanka Handicrafts Bank (20.8) Board (4.2) 6.Sri Lanka Insurance 5.Independent Television Corporation (20.8) Network (4.2) 7.Airport and Aviation 6.Lanka Mineral Sands Services (20.8) (4.2) 8.SriLankan Airlines 7.Sri Lanka State (20.8) Plantations Corporation (4.2) 9.State Mortgage & Investment Bank (16.7) 8.Janatha Estates Development Board 10.Employees’ Trust Fund (4.2) (16.7) 9.National Livestock 11.Ceylon Electricity Development Board Board (16.7) (4.2) 12.Ceylon Petroleum 10.State Engineering Corporation(16.7) Corporation of Sri Lanka
13.Development Lottery (4.2)
Board (16.7)
Table 3
Auditing Standards
OECD states that SOE auditing and accounting standards as a common practice help to compare SOEs with stock-market listed companies. Auditing standards of SOEs in Sri Lanka are evaluated based on the established standards of the Sri Lanka Auditing Standard (SLAuS). The Sri Lanka Auditing Standard provides guidance on how the audit should be performed by an independent auditor of the financial statements of an entity. The auditor’s opinion was recorded based on the latest annual report available for the SOE and colour-coded as given below
OECD (2021), Ownership and Governance of State-Owned Enterprises: A Compendium of National Practices 2021.
Chapter 05: Measuring SOE performance
AUDITOR’S OPINION
COLOUR
Unqualified
Qualified
Disclaimer Figure 9
The weighted average was calculated based on the values allocated to each colour code. The top rated SOEs are the ones which had an unqualified opinion as the auditing standard while the worst rated SOEs have a disclaimer for their financial statements.
TOP SOEs
WORST SOEs
1.Bank of Ceylon (25) 1.Sri Lanka Ports Authority (0) 2.People’s Bank (25) 2.Sri Lanka Transport 3.National Savings Bank Board (0) (NSB) (25) 3.Milco Ltd (0) 4.State Mortgage & Investment Bank (25) 4.National Livestock Development Board (0) 5.HDFC Bank (25) 5.Sri Lanka State 6.Regional Development Plantations Corporation Bank (25) 7.Sri Lanka Export Credit 6.Janatha Estates Insurance Corporation Development Board (0) 7.SL Ayurvedic Drugs 8.SriLankan Airlines Ltd Corporation (0) 8.Sri Jayawardenapura 9.Lanka Phosphate Ltd General Hospital (0 9.Sri Lanka Broadcasting 10.Kahatagaha Graphite Corporation (0) Lanka Ltd (25) 10.Sri Lanka Handicraft 11.SL Rupavahini Board (0) Corporation (25) 11.Lanka Sathosa Ltd (0) 12.Hotel Developers Lanka PLC 12.Ceylon Fishery Harbour Corporation (0) 13.Lanka Sugar Company
Table 4
5.4.2: RIGHT TO INFORMATION
Under the Right to Information Act No. 12 of 2016, all state and public institutions which are maintained by taxpayer money should ensure the fundamental principle of sharing information of the functions accomplished by public funds. Thus, we assessed how SOEs commit to the Right to Information Act using the two sub indicators mentioned below. Is the information pertaining to the RTI officer available on the website? Does the SOE respond to a RTI within the timeframe specified in the Act?
Information regarding the RTI officer was checked up on the website to fill in the first sub indicator. For the second sub indicator RTI request letters were sent to all 52 SOEs and each reply was recorded in order to take it to the scorecard. The weighted average was calculated for each sub indicator based on the values allocated to each colour-code. The score for the main indicator was the summation of the scores of the two sub indicators. The top rated SOEs have the information on RTI officers available on their website and also have replied to RTI request letters sent by Advocata.
WORST SOEs
TOP SOEs
1.Ceylon Petroleum
*39 SOEs fall under Corporation (25)
this category 2.National Water Supply and Drainage Board (25) 3.Airport and Aviation Services (SL )Ltd (25) 4.SriLankan Airlines (25)
Table 5
Chapter 05: Measuring SOE performance
5.4.3: ACCESSIBILITY OF INFORMATION
Access to information ensures the core principles of good governance such accountability, transparency and participation as mentioned by UNESCO. Thus, state run enterprises should have high quality and timely information available to the public. There are three sub indicators to evaluate the accessibility of information in SOEs, Does the SOE have a website? Does the SOE website contain sufficient organisational details? Does the SOE website contain tender and procurement details? The availability of a website for a SOE was a necessity to fulfil the next two conditions. The sufficiency of organisational details and availability of tender and procurement details were assessed thoroughly based on justifications mentioned in the annexure. Based on the compliance to the justification, the sub indicators were colour coded in green, amber or red. The score for the main indicator depended on the weighted average scores of the sub indicators. The Top rated SOEs have a score of 25 percent which implies that they’ve adhered to PED guidelines while the worst rated ones have a score varying from 0 percent – 8.3 percent.
TOP SOEs
WORST SOEs
1.Bank of Ceylon (25)
1.Sri Lanka Handicrafts Board (0) 2.People’s Bank (25) 2.Agriculture and 3.Regional Development Agrarian Insurance Board Bank (25) 4.Sri Lanka Insurance 3.State Engineering Corporation (25) Corporation of Sri Lanka (8.3) 5.Airport and Aviation Services (Sri Lanka) Ltd 4.Milco Ltd (8.3) 5.National Livestock Development Board (8.3) 6.Sri Lanka Broadcasting Corporation (8.3) Table 6
UNESCO. “Monitoring and Reporting on Access to Information.” UNESCO. en.unesco.org, March 9, 2021. https://en.unesco.org/themes/mon itoring-and-reporting-access-information.
Composite Score for the Governance Indicators The four main indicators determined how the 52 strategic SOEs apply governance best practices within the SOEs. A composite figure was calculated by summing up the scores each SOE received for the four indicators. Based on that score SOEs are ranked as the top rated and worst rated by the composite score they’ve received.
WORST SOEs
TOP SOEs
1.SriLankan Airlines
1.Sri Lanka Handicraft (91.7)
Board (4.2) 2.Bank of Ceylon (83.3)
2.National Livestock Development Board 3.People’s Bank (83.3) (12.5) 4.Airport and Aviation 3.Milco Ltd (16.7) Services (Sri Lanka) Ltd 4.Sri Lanka State
(83.3) Plantations Corporation 5.National Savings Bank (16.7) (79.2) 5.Janatha Estates 6.Ceylon Petroleum Development Board Corporation (75) (16.7) 7.National Water Supply 6.Sri Jayawardenapura and Drainage Board General Hospital (20.8) (70.8) 7.Sri Lanka Broadcasting 8.Regional Development Corporation (20.8) Bank (70.8) 8.Lanka Sugar Company Ltd (20.8)
Table 7
5.5:
Methodology of Financial Indicators
Return on Assets Ratio analysis is a technique widely used by analysts and investors to compare the performance of companies against their peers and/or competitors. This technique is primarily used due to the lack of standardised points of reference to evaluate the multidimensional concepts of management effectiveness and efficiency. Furthermore, these ratios are used as benchmarks of company performance across time and varying economic conditions.
Chapter 05: Measuring SOE performance
Some commonly used ratios for this purpose include Return on Equity (ROE), Gross Profit Margin, Inventory Turnover Ratio, Return on Investment, Return on Assets, etc. Of these ratios, Return on Assets (ROA) stands out as a metric of management efficiency. ROA is a financial ratio that shows the percentage of profit a company earns in relation to its overall resources. Therefore, it is a key profitability ratio which evaluates how efficiently a company is able to generate profit with the assets it has available. It is calculated by dividing net income by total assets. ROA = Net Income/Total Assets*100 Net income is a company’s profit after taxes. Total assets include the sum of the company’s current and noncurrent assets. These include: cash and cashequivalent items such as receivables, inventories, land, equipment (less depreciation), and patents. Generally, the higher the ROA, the better the management. ROA gives an indication of the capital intensity of the company, which will depend on the industry. This is why it is advised, when using ROA as a comparative measure, to compare it against a company’s previous ROA figures or the ROA of a similar company operating in the same industry. However, since the team could seldom find like-forlike comparisons in the private sector and the region to compare SOE ROAs against, the team sought to compare the SOE ROAs against the government’s cost of borrowing. The effective interest rate at which the government borrows would be indicative of the cost funding the investment in the SOE and serves as a benchmark against which to measure performance. Public investment is never cost-free. As resources are finite, public investment will either displace private consumption or investment; therefore it is necessary to measure the efficiency of public investment including that in state enterprises.
Effective Borrowing Cost of Government Debt The effective interest rate on debt is given by: i = i/D ttt-1 where it denotes the interest expense for debt during period t, expressed in domestic currency and D t-1
Ormaechea, Santiago Acosta, and Leonardo Martinez. “A Guide and Tool for Projecting Public Debt and Fiscal Adjustment Paths with Lo cal-and Foreign-Currency Debt.” International Monetary Fund, 2021
denotes the debt stock for period t-1. This coefficient is used as a measure of the cost of borrowing for the government. The comparison between the SOE ROA and the Effective Borrowing Cost of government debt seeks to highlight how efficiently the government funds have been utilised by the SOEs. As the manager of SOEs, the government needs to exercise an active ownership policy by defining social welfare objectives and setting financial targets for SOEs. In the absence of stated financial targets, the effective cost of government borrowing is used as a benchmark. In its active role as an manager, the government has to constantly review financial performance and the social objectives of SOEs.
Financial Indicator Analysis (ROA Analysis for SOEs)
Phase I The preliminary phase of research showed that only a handful of SOE Annual Reports contained ROA values across the years. Therefore, in the interest of maintaining uniformity in the analysis, ROA was calculated for all SOEs. The standard ROA equation used for this purpose was: ROA= Net Profit/Average Total Assets *100 Net Profit refers to profit after deducting all relevant costs, including tax. For SOEs that did not have annual reports or financial statements, Profit Before Tax values available in the Ministry of Finance Report for each year were used for the calculations. Average Total Assets was calculated by adding the opening and closing asset balances and dividing them by two. Data for Net Profits and Average Total Assets was collected for the 52 SOEs from 2015-2020.
Phase II Once data collection was complete, the ROA was calculated for all SOEs from 2015 to 2020 using the formula above. An Average ROA was calculated for each SOE by computing the sum of the ROAs from 2015-2020 and dividing it by six.
Chapter 05: Measuring SOE performance
Phase III The equation for the effective interest rate was defined as i t = i t /D t-1 based on the IMF Debt Dynamics Tools. Foreign and domestic debt data was collected for the years 2015 to 2020. The annual effective interest rate was calculated for each year and then summed up and divided by 6 to derive an Average Effective Interest Rate (AEIR).
Phase IV Each SOE’s ROA was compared against the AEIR based criteria such as:
- SOEs with negative ROA
- SOEs with positive ROA but below the government
cost of borrowing
- SOEs for which the ROA exceeds the government cost
of borrowing
Phase V As an additional analysis, SOEs were grouped based on the spread of the deviation among the 52 SOEs as a portfolio of government investment. Therefore, quartiles were defined for the range and colour codes were assigned based on which quartile each SOE fell into (see Table 1).
0%- 25%(52.9) – (1.5)
Total Failure
25%-50%(1.5) – 1
Unsuccessful
50% – 75%1 – 3.95
Marginally Successful
75% – 100%3.95 – 76.9
Successful
Table 8
Ministry of Business, Industry and Innovation, Annual Report for State-Owned Enterprises 2020. (Stockholm, Sweden: Government Offices of Sweden)
Chapter 05: Measuring SOE performance
SOE Development Lotteries Board National Insurance Trust Fund Lanka Mineral Sands Ltd State Pharmaceuticals and Manufacturing Corp. Sri Lanka Cashew Corporation State Pharmaceuticals Corporation Kurunegala Plantations Ltd State Timber Corporation Airport and Aviation Services (SL )Ltd Employees’ Trust Fund Board Chilaw Plantations Ltd National Lotteries Board SL Ayurvedic Drugs Corporation Lanka Sugar Company Ltd Sri Lanka Insurance Corporation Sri Lanka Transport Board Kalubowitiyana Tea Factory Ltd Central Engineering Consultancy Bureau Sri Lanka Export Credit Insurance Corporation Lanka Phosphate Ltd Sri Lanka Handicraft Board STC General Trading Company People’s Bank Sri Lanka Broadcasting Corporation State Mortgage & Investment Bank (SMIB) HDFC Bank (HDFC) Bank of Ceylon Ceylon Fertilizer Company Ltd National Savings Bank (NSB) Milco Ltd Colombo Commercial Fertilizer Company Ltd State Development and Construction Corp. Pradeshiya Sanwardhana Bank (RDB) Hotel Developers Lanka PLC National Water Supply and Drainage Board Sri Lanka Ports Authority Independent Television Network Ltd Ceylon Fishery Harbour Corporation Kahatagaha Graphite Lanka Ltd Sri Lanka State Plantations Corporation Ceylon Electricity Board National Livestock Development Board Ceylon Petroleum Corporation State Printing Corporation State Engineering Corporation of Sri Lanka Ceylon Fisheries Corporation Janatha Estates Development Board Sri Jayawardenapura General hospital SL Rupavahini Corporation Lanka Sathosa Ltd SriLankan Airlines Ltd Agriculture and Agrarian Insurance Board
SOE Code
ROA DLB
76.9 NITF
21.1 LMS SPMC
8.9 SLCC
8.6 SPC
8.3 KURU.P
7.6 STC
7.6 AASSL
6.4 ETFB
6.2 CHILAW P
5.6 NLB SLADC
4.1 LSC
3.9 SLIC
3.3 SLTB
2.8 KTF
2.6 CECB
2.6 SLECIC
2.3 LP
2.1 SLHB
1.7 STC GTC
1.6 PB
1.3 SLBC
1.3 SMIB HDFC BOC CFC
0.9 NSB
0.9 MILCO
0.9 CCFC
0.8 SDCC
0.8 RDB
0.6 HDL
0.5 NWSDB
0.2 SLPA
-0.1 ITN
-0.1 CFHC
-1.1 KGL
-1.2 SLSPC
-2.4 CEB
-3.4 NLDB
-3.7 CPC
-4.2 SPC
-4.5 SECSL CFC
-5.1 JEDB
-10.1 SJGH
-10.3 SLRC
-11.9 Sathosa
-33.6 SLA AAIB
-52.9
Table 9
Chapter 05: Measuring SOE performance
Note The quantiles displayed above were all generated using R statistical computing.
There were several instances where the data for the calculation of the ROA was not publicly accessible across several years. In cases as such, the average was calculated based only on the information that was publicly accessible.
Comparing ROA with the Average Effective Interest Rate
ROA of 52 Strategic SOEs
MILCO
SMIBSLBC
SDCCCCFC
NSB
BOC
Sathosa
AAIB
SECSLNLDB
NWSDB
CFC
HDFC
CFHC
HDLRDB
SLRCSJGHJEDB
SLSPC
SLA
CFCSPCCPCCEBKGL
ITN
SLPA
Average Effective Interest Rate
Figure 10 shows the average ROA of the 52 strategic SOEs. The data has been sorted from the lowest on the left side to the highest on the right side. The highest ROA is recorded by the Development Lotteries Board, which is 76.9% while the lowest ROA is -52.9%, recorded by the Agriculture and Agrarian Insurance Board. Based on the data in Table 9, 17 SOEs recorded a negative average ROA while 35 SOEs recorded a positive average ROA. The red horizontal line shows the average effective interest rate of 7.5% which represents the cost of government borrowing for the period (2015-2020). The government should set financial targets to measure the performance of SOEs. In the absence of financial targets this report uses the government cost of borrowing as an indicator to measure SOE performance.
When the government deploys funds to state enterprises it should be expected, at a minimum, to cover the cost of financing. Comparing the return on assets from state enterprises with the cost of government borrowing gives an indication of whether the government is able to earn a return on its investments in excess of the cost of its borrowing. It
CHILAWP
AASSL
SLADC
SLECIC
STC GTC
SLCC
LMSNITF
SPMC
SLHBCECB
SLICNLB
KURU.P
STC
SPC
DLB
KTFLSC
SLTB
ETFB
PBLP
Figure 10
may be argued that SOE’s have certain social obligations and therefore should not be evaluated purely in terms of financial return. The SOE’s that perform any noncommercial activities must quantify and report on these. The financial return can then be adjusted for the non commercial activities and a net overall return calculated. Comparison with the government borrowing costs will remain valid when the return is adjusted for the noncommercial obligations, where applicable. The onus is on the SOE to identify, quantify and report on the value of non-commercial obligations to enable a proper evaluation of its activities.
Not all SOEs are funded through government borrowing; some, such as banks, use public deposits as well. Nevertheless, ROA is a good measure of performance and is an indication of the quality of management. “ROA is not a perfect measure, but it is the most effective, broadly available financial measure to assess company performance. It captures the fundamentals of business performance in a holistic way, looking at both income statement performance
Chapter 05: Measuring SOE performance
and the assets required to run a business. Commonly used metrics such as return on equity or returns to shareholders are vulnerable to financial engineering, especially through debt leverage, which can obscure the fundamentals of a business”
When compared to government borrowing costs, it indicates the cost of the component of funds that are tied up within SOEs.
The entities evaluated are those classified by the government as SOEs. Entities such as the Employees’ Trust Fund (ETF) do not use government funds although they are managed by a government agency.
In terms of absolute profit, the banking and finance sector is the best performer. The 7 SOEs in this sector reported a profit of LKR 77 Billion in 2020. While the banking sector reports high absolute levels of profits, the average return on assets for the sector is 1 or below; slightly lower than the private sector competitors in Sri Lanka. The largest private sector banks, Commercial Bank and Hatton National Bank, report average ROAs (2015-2020) of 1.38 and 1.49 (see Table 11) respectively which suggests that these private banks are getting a return that is 40% – 50% better than the state owned banks. The private sector banks are much smaller in scale than the state banks and are not directly comparable, but do provide an indication of the possible return that may be available in the sector.
The least profitable sector is the energy sector, where the SOEs generated aggregate losses of LKR 46 Billion in the year 2020. The two SOEs in the energy sectorCPC and CEBrecord negative average ROA of -4.2 and -3.4 respectively. However, these SOEs are monopolies so there are no similar local comparators. Therefore we looked at the performance of regional operators in the energy sector as given in Table 11.
SriLankan Airlines, Lanka Sathosa and the State Engineering Corporation of Sri Lanka are the other biggest loss makers within the period of 2015 to 2020. Average annual loss of SriLankan Airlines, Lanka Sathosa and the State Engineering Corporation of Sri Lanka are LKR 26.9 billion , LKR 2.7 billion and LKR 0.99 billion respectively.
Deloitte Center for the Edge, “Success or Struggle: Success or struggle: ROA as a true measure of business performance. Report 3 of the 2013 Shift Index series”. October 31, 2013. https://www2.deloitte.com/content/dam/insights/ us/articles/success-or-struggle-roa-as-a-true-measure-of-business-performance/DUP505_ROA_vFINAL2.pdf.
The 8 SOEs that have exceeded the government cost of borrowing are in different sectors such as Marketing and Distribution, Plantations, Pharmaceuticals, Nonrenewable resources, Insurance and Lotteries.
The table below classifies the SOE’s into three groups based on the average ROA as given in Table 10.
Chapter 05: Measuring SOE performance
SOEs with negative ROA
SOEs with positive ROA but below the government cost of borrowing Agriculture and Agrarian Insurance
National Water Supply and Drainage Board
Board SriLankan Airlines Ltd
Hotel Developers Lanka PLC Lanka Sathosa Ltd
Pradeshiya Sanwardhana Bank (RDB) SL Rupavahini Corporation
State Development and Construction Corp. Sri Jayawardenapura General hospital
Colombo Commercial Fertilizer Company State Pharmaceuticals and Ltd Janatha Estates Development Board
Milco Ltd Ceylon Fisheries Corporation
National Savings Bank (NSB) State Engineering Corporation of Sri LankaCeylon Fertilizer Company Ltd State Printing Corporation
Bank of Ceylon Ceylon Petroleum Corporation
HDFC Bank (HDFC) National Livestock Development BoardState Mortgage & Investment Bank (SMIB) Ceylon Electricity Board
Sri Lanka Broadcasting Corporation Sri Lanka State Plantations CorporationPeople’s Bank Kahatagaha Graphite Lanka Ltd
STC General Trading Company Ceylon Fishery Harbour Corporation
Sri Lanka Handicraft Board Independent Television Network Ltd
Lanka Phosphate Ltd Sri Lanka Ports Authority
Sri Lanka Export Credit Insurance Corporation Central Engineering Consultancy Bureau Kalubovitiyana Tea Factory Ltd Sri Lanka Transport Board Sri Lanka Insurance Corporation Lanka Sugar Company Ltd SL Ayurvedic Drugs Corporation National Lotteries Board Chilaw Plantations Ltd Employees’ Trust Fund Board Airport and Aviation Services (SL) Ltd
ROA of Domestic/Regional Private
competitors
The ROA of regional and private competitors were also calculated in order to derive a possible trend of average industry performance. All private and regional competitors chosen performed activities that were of similar nature to the SOEs of that industry, and the ROA was calculated with the same method as described above.
SOEs of which the ROA exceeds the government cost of borrowing State Timber Corporation
Kurunegala Plantations Ltd State Pharmaceuticals Corporation Sri Lanka Cashew Corporation
Manufacturing Corp. Lanka Mineral Sands Ltd National Insurance Trust Fund Development Lotteries Board
Table 10
It is important to note that while this information does have a certain indicative nature it cannot act as a complete benchmark for the sake of a fair comparison, since some of these competitors were much larger (or smaller) in scale.
Chapter 05: Measuring SOE performance
Name of Private Competitor Banking and Finance Licensed Commercial Banks Commercial Bank National Development Bank Seylan Bank Hatton National Bank Sampath Bank Licensed Specialized Banks Bank of India Union bank of India Axis bank HDFC India National Housing Bank – India Bank Simpanan Nasional Malaysia Insurance Life Insurance Ceylinco life Insurance General Insurance Ceylinco Insurance Plc Agriculture Insurance Agriculture Insurance Company of India Energy Electricity Ashuganj Power Station Company Ltd (Bangladesh) Electricity Generation Company of Bangladesh Power LIOC Ports Chittagong Port Authority Penang Port Commission Water Carmona Water District Philippines PUB Singapore Aviation Airport authority Airport Authority India Airlines Singapore Airlines Malaysian Airlines Transport SBS Transit Konsortium Transnasional Berhad Construction Access Engineering PLC Serendib Engineering Group PLC TARMAT PLC Consultancy & Construction MITCON Consultancy TEAM Consulting Engineering and Management PCL Livestock Livestock & Dairy Lanka Milk Foods (CWE) PLC Dairy Kotmale Holdings
Country
Avg. ROA
Industry Avg.
Sri Lanka
1.38 Sri Lanka
1.39 Sri Lanka
0.97
1.31 Sri Lanka
1.49 Sri Lanka
1.32
India
-0.54 India
-0.24 India
0.64 1.54 India
1.86 India
6.96 Malaysia
0.57
Sri Lanka
7.79
7.79
Sri Lanka
4.84
4.84
India
7.70
7.70
Bangladesh
6.93 4.33 Bangladesh
1.73
Sri Lanka
4.50
4.50
Bangladesh
54.52 28.09 Malaysia
1.65
Philippines
19.95 11.52 Singapore
3.09
India
6.63
6.63
Singapore
0.18
0.24 Malaysia
0.30
Singapore
5.09 -3.57 Malaysia
-12.24
Sri Lanka
7.14 Sri Lanka
22.80
10.39 India
1.22
India
2.79 4.66 Thailand
6.53
Sri Lanka
2.16
2.16
Sri Lanka
11.63
11.63
Table 11
Chapter 05: Measuring SOE performance
Name of Private Competitor Plantation Tea Plantation + Minor Crops Talawakelle Tea Estates PLC Other Plantations Mahaweli Coconut Plantations Ltd. Non-renewable resources Bogala Graphite Lanka PLC Fertilizer Ghatprabha Fertilizers Private Limited Lotteries PCSO Lottery Draw Magnum Berhad Health Pharmaceuticals Morison Pharmaceuticals Limited Distribution MULLER & PHIPPS (CEYLON) PLC DKSH Malaysia Sdn Bhd Health care Nawaloka Hospitals Durdans Hospitals Asiri Hospital Holdings Media Television & Radio Prasar Bharati Radio KAL RADIO LIMITED Television RAJ TELEVISION NETWORK LTD Creative Eye Limited Marketing and Distribution Gifts and Speciality Malaysian Handicraft Development Corporation Timber KPS CONSORTIUM BERHAD General Trade Central Industries PLC Taaza international Limited Food and Retail Cargills Food Retailers Printing Acme Printing & Packaging PLC Printcare PLC Fish and Marine products Zeal Aqua Fertilizer AgStar PLC SPIC PLC Hospitality Galadari Hotels (Lanka) PLC Renuka Hotels PLC Sugar Indian Sucrose Limited Ponni Sugars(E)
Country
Avg. ROA
Industry Avg.
Sri Lanka
8.15
8.15
Sri Lanka
13.17
13.17
Sri Lanka
8.54
8.54
India
1.28
1.28
Philippines
2.99 3.61 Malaysia
4.22
Sri Lanka
5.82
5.82
Sri Lanka
-0.63 3.11 Malaysia
6.85
Sri Lanka
0.76 Sri Lanka
6.15
4.50 Sri Lanka
6.59
India
19.51
19.51
India
5.54
5.54
India
-0.88 -3.38 India
-5.88
Malaysia
-2.19
-2.19
Malaysia
0.66
0.66
Sri Lanka
8.97 4.17 India
-0.64
Sri Lanka
3.45
3.45
Sri Lanka
-10.45 -4.65 Sri Lanka
1.16
India
3.08
3.08
Sri Lanka
2.48 2.51 India
2.53
Sri Lanka
0.94 4.98 Sri Lanka
9.03
India
3.32 3.89 India
4.45
Table 11
Chapter 05: Measuring SOE performance
SOE Performance Indicators
Based on data for 2020
13.6%
Combined turnover to GDP
Combined losses as a percentage of the
6.1%
budget deficit
Combined profits as a percentage of the
7.6%
budget deficit
Total SOE debt as a percentage of public
debt
Contingent liabilities
the total value of treasury guarantees issued as a percentage of public debt
Sources: CBSL Annual Report 2020 & Advocata SOE Database
Figure 11
CHAPTER 06
REFORMING SOES;
LESSONS FROM ASIA
6.1:
Temasek & Khazanah
Other nations have had success with creating separate publicly owned holding companies to manage government owned commercial assets and companies (SOEs). This section will focus on Temasek Holdings Ltd (Singapore) and Khazanah Nasional Berhad (Malaysia). Both companies were originally founded as holding companies for state-owned commercial enterprises but have since expanded to become strategic investment funds with international exposure . These companies have been successful in overseeing their assets and have grown to be large sovereign wealth funds (SWFs) with diverse asset portfolios. Yet the respective governments have adopted considerably different management strategies for the two SWFs, as will be explained below.
Dixon, Adam D. “The strategic logics of state investment funds in Asia: Beyond financialisation.” Journal of Contemporary Asia 52, no. 1 (2022): 127-151. Cummine, Angela. “How Temasek Has Driven Singapore’s Development | East Asia Forum.” East Asia Forum. www.eastasiaforum.org, February 17, 2015. Retrieved March 9, 2022. https://www.eastasiaforum.org/2015/02/17/how-temasek-has-driven-singapores-development/. Chen, Christopher. “Solving the puzzle of corporate governance of state-owned enterprises: The path of the Temasek model in Singapore and lessons for China.” Nw. J. Int’l L. & Bus. 36 (2016): 312. Ibid. Ng, Wei Jie Nicholas. “Comparative Corporate Governance: Why Singapore’s Temasek Model Is Not Replicable in China.” NYUJ Int’l L. & Pol. 51 (2018): 223. Ibid. Temasek Review 2021 Highlights. (Singapore: Temasek Holdings Limited, 2021.) Temasek Review 2021. “Total Shareholder Return – Investor | Temasek Review 2021.” www.temasekreview.com.sg. Accessed March 10, 2022. https://www.temasekreview.com.sg/investor/total-shareholder-return.html
6.1.1: Temasek Holdings Limited
Following independence in 1965, the Singaporean government was in need of capital and investments. To encourage foriegn investment the government acquired minority stakes in to share risk in the venture; the acquisition of minority stakes was also used to support domestic start-up companies in strategic sectors. In order to prevent a conflict of interest, Temasek Holdings was created in 1974 in accordance with the idea that “ the Government should not be involved in [the] management of businesses’’ and that “the Government and civil servants should focus on policy.” Singapore’s government does not interfere in Temasek’s board nor its operations, and maintains the principles of nonintervention and non-preference.
Temasek was first created with a portfolio of 35 GLCs (government linked companies), of which 12 remain under its control. The company has seen steady growth since its founding, and is now worth over US$279 billion; its 40 year compounded growth rate is 13%. In 2002, the government announced that while it would “not favour GLCs with special privileges or hidden subsidies” or “burden them with uneconomic
Chapter 06: Reforming SOEs; Lessons from Asia
‘national service’ responsibilities”, GLCs were “expected to compete on a level playing field” . To this end, both the government and Temasek have made clear their preference for GLCs to be publicly listed to so that they would be subject to the rigours of marketbased competition . As a result, Temasek GLCs hold 37% of the value of the Singapore Exchange (SGX) stock market. There is also a policy of non-preference towards GLCs. This is particularly seen as GLCs tend to maintain a higher cash-asset ratio than non-GLCs, which could signify that they have to maintain their own reserves in case of distress and cannot rely on the government. Despite (or perhaps due to) this, Singapore’s GLCs remain highly profitable, have a better return-on-equity ratio and return-on-assets ratio , and have valuations that are, on average, 1% higher than non-GLCs .
Temasek’s assets are mostly centred in Asia. The two largest countries where it owns assets are China (27% of total assets) and Singapore (24%), although it maintains investments worldwide. The Company differs from most other SWFs as it has been entirely self-financed for the vast majority of its history. Its five main sources of finance are company dividends, divestment proceeds, distributions of fund investment earnings and longand short-term debt issuances. Temasek and other entities that handle Singaporean reserves provide a substantial return to the state by regularly contributing to the national annual budget through the Net Investment Return Contribution framework (which constitutes 1/5 of the annual budget), thus reducing dependency on income tax revenue.
Sim, Isabel, Steen Thomsen, and Gerard Yeong. “The State as Shareholder: The Case of Singapore. Centre for Governance, Institutions & Or ganisations, NUS Business School.” (2014). Ibid. Ng, Wei Jie Nicholas. “Comparative Corporate Governance: Why Singapore’s Temasek Model Is Not Replicable in China.” NYUJ Int’l L. & Pol. 51 (2018): 221 Ibid., 224. Ibid., 221. Ibid., 222. Loh, Dylan (2021, July 13). Singapore’s Temasek Records returns of 24.5%, highest in a decade. Nikkei Asia. Retrieved March 10, 2022, from https://asia.nikkei.com/Business/Companies/Singapore-s-Temasek-records-returns-of-24.5-highest-in-a-decade Cummine, Angela. “How Temasek Has Driven Singapore’s Development | East Asia Forum.” East Asia Forum. www.eastasiaforum.org, February 17, 2015. Retrieved March 9, 2022, https://www.eastasiaforum.org/2015/02/17/how-temasek-has-driven-singapores-development/. Yeap, Cindy. “Cover Story: Khazanah Strives towards ‘Advancing Malaysia.’” The Edge Markets. www.theedgemarkets.com, February 3, 2022. Accessed March 10, 2022, https://www.theedgemarkets.com/article/cover-story-khazanah-strives-towards-advancing-malaysia. Al-Hassan, Abdullah, Mr Michael G. Papaioannou, Martin Skancke, and Cheng Chih Sung. Sovereign wealth funds: Aspects of governance struc tures and investment management. International Monetary Fund, 2013: 10. Chen, Christopher. “Solving the puzzle of corporate governance of state-owned enterprises: The path of the Temasek model in Singapore and lessons for China.” Nw. J. Int’l L. & Bus. 36 (2016): 321.
Temasek operates under the ‘investment company model’ of sovereign wealth funds wherein the government creates an investment company to manage assets and does not directly give an investment mandate to an asset manager (the ‘manager model’) . As aforementioned, the state does not play an active role in the day to day operations of the fund or its assets, thus preventing a conflict of interest. While the President of Singapore must concur with the appointment of a CEO or director of the fund to ensure the fund operates in the broad commercial interest of the state, government officials have no constitutional power to interfere with the management and operations of the company . It should be noted, however, that the long time CEO Ho Ching (2004-2021) is the wife of Prime Minister Lee Hsein Loong and about ¼ of the board of directors are also members of the political elite indicating the potential for some (albeit informal) influence from the state .
Cummine, Angela. “How Temasek Has Driven Singapore’s Development | East Asia Forum.” East Asia Forum. www.eastasiaforum.org, February 17, 2015. Retrieved March 9, 2022, https://www.eastasiaforum.org/2015/02/17/how-temasek-has-driven-singapores-development/
Chapter 06: Reforming SOEs; Lessons from Asia
6.2:
Singapore Net Investment Return
Contribution (NIRC)
The NIRC contributions are obtained from the returns of Singapore’s sovereign wealth funds (the GIC and Temasek) and the Monetary Authority of Singapore (the Central Bank). It consists of 50% of the Net Investment Returns (NIR) on the net assets invested by these companies and 50 per cent of the Net Investment Income (NII) derived from past reserves from the remaining assets . The fund contributes heavily to the government budget: of the S$102.4 billion estimated budget for 2022, returns from the NIRC will make up S$21.6 billion (just over US$18.3 billion) and is up 6% from 2021 . The government ensured the longevity and sustainability of NIRC contributions by enacting legislation including the aforementioned 50% cap as well as the use of real rather than nominal returns (real returns are adjusted for inflation and are hence likely to be smaller). The fund has become increasingly valuable as Singapore has had its third consecutive budget deficit as it maintains expansionary fiscal policy in the wake of COVID. A main benefit of the NIRC is that the state has been able to reduce its reliance on tax revenues. While the OECD average of tax revenues as a percentage of GDP is 21% as of 2019, Singapore’s fell to 10.5% in 2018 . There have, however, been criticisms of the NIRC. There have been concerns that, despite the 50% cap, it is
Tan, Randolph. “Budget 2018 – What’s Good and Not so Good about NIRC.” TODAY. www.todayonline.com, February 27, 2018. https://www. todayonline.com/commentary/budget-2018-whats-good-and-not-so-good-about-nirc. Ibid. Devi, Uma. “Budget 2022: Singapore Sees Third Straight Deficit in FY2022, Narrowing to S$3b.” Business Times. www.businesstimes.com.sg, February 21, 2022. https://www.businesstimes.com.sg/government-economy/budget-2022-singapore-sees-third-straight-deficit-in-fy2022-nar rowing-to-s3b. Tan, Randolph. “Budget 2018 – What’s Good and Not so Good about NIRC.” TODAY. www.todayonline.com, February 27, 2018. https://www. todayonline.com/commentary/budget-2018-whats-good-and-not-so-good-about-nirc. Teo, Desmond, and Pui Ming Soh. “Winds of change in tax collection in a post-pandemic landscape| EY Singapore.” Tax collection in a post-pandemic landscape | EY Singapore. www.ey.com, December 21, 2021. https://www.ey.com/en_sg/tax/winds-of-change-in-tax-collectionin-a-post-pandemic-landscape. Ibid. Ibid. Tan, Mindy. “Singapore Government Not Accumulating More Reserves than Necessary: Wong.” Business Times. www.businesstimes.com.sg, March 3, 2022. https://www.businesstimes.com.sg/government-economy/singapore-government-not-accumulating-more-reserves-than-neces sary-wong.
drawing from the state reserves at a rate that does not allow for a sufficient buffer in case of an emergency. Further, increasing reliance on the NIRC means that the economy may be vulnerable to market volatility, particularly in the case of returns generated by Temasek. The potential for such volatility and declines in the company’s portfolio were the reasons that Temasek was not inducted into the NIRC until 2015. The dependency on the NIRC has expanded to the extent that there have been calls to increase the cap to 60% , which threatens the state’s traditionally prudent fiscal measures and balanced budget. The NIRC is another advantage of establishing a Temasek-esque sovereign wealth fund to manage Sri Lankan SOEs. Following their corporatisation and sound fiscal management, the SOEs will soon begin producing revenues for the state – half of which can be kept in reserves in case of an emergency and half of which can be used by the state in its annual budget.
Chapter 06: Reforming SOEs; Lessons from Asia
Temasek structure (Investment company model)
SG President, PM, etc Appointing, reappointing. and removing CEO / board requires president’s Ministry of Finance
concurrence.President is required by law to listen to their council of advisors before making a decision.
Wholly owned but no intervention. Otherwise no role except managing past Temasek (divested) reserves
Board No Role
Overall guidance & policy directions
Management
No role in day-to-day operations & business decisions Holds board and management accountable for a company’s activities and overall performance
- Advocate board and
management be independent
- Advocates that chairman and
CEO be separate
- Exercises shareholder
privilege and voting rights
Portfolio companies
Foreign investments
Telecommunications, Consumer & real Financial Services
media, estate and technology
- DBS Group Holdings
- Singapore
- CapitaLand Limited
Limited
Technologies
- M+S Pte Ltd
telemedia Pte Ltd
- Surbana Jurong
- Mediacorp Pte Ltd
private Limited
- Singapore
- Mandal Park Holdings
Telecommunications
- pte Ltd
Limited
- Mapletree
Investments Pte Ltd
May have been some informal influence: CEO (2004-21) was wife of PM (but qualified for role): 25%of board are members of political elite
Executive Committee
Audit Committee
Leadership Development and compensation Committee
Helps Board to carry out duties:
- Overall long-term strategic objectives
- Annual budget
- Annual audited statutory accounts
- Major investment and divestment
proposals
- Major funding proposals
- CEO appointment and succession
planning
- Board changes
Domestic GLCs
Transportation &
Life sciences and industrial
agri-food
- Keppel Corporation
- Olam International
Limited
Limited
- PSA International Pte Ltd
- Sembcorp Industries Ltd
and Sembcorp Marine Ltd
- Singapore Technologies
- Engineering Ltd
- SATS Ltd
- Singapore Airlines
- Limited
- Singapore Power Limited
- SMRT Corporation Ltd
Figure 11
Chapter 06: Reforming SOEs; Lessons from Asia
6.1.2: Khazanah Nasional Berhad
Khazanah was established in 1994 to take a custodial role in managing the Malaysian government’s commercial assets and to invest in strategic sectors . In 2004, this mandate was increased to allow an active investor role and to allow investments in “different economic sectors and geographies” . In 2018, its mandate was updated and the organisation’s role is to “grow Malaysia’s long term wealth” through a commercial fund (an inter-generational wealth fund) and a strategic (developmental) fund. Khazanah was initially seeded with approximately US$620 million worth of government assets in 1994, of which about $24 million was cash . Its portfolio has since grown to approximately US$32 billion as of 2022. Its compounded annual growth rate since 2004 has been 5.8%. Unlike Temasek, the company’s exposure is primarily domestic (63.5%) but similar to Temasek is concentrated in Asia (China, 14.8%; Rest of Asia, 12%) . This is likely due to the ‘Advancing Malaysia’ mandate given to it by the Ministry of Finance as explained below. The Malaysian government adopted a more interventionist investment strategy than in Singapore , leaning closer to the ‘manager model’ of SWFs. The 2004 reforms to the organisation improved the quality of top management and the board of directors and further introduced a shift in strategy – Khazanah is now focused on strategic overseas investment (particularly through co-investment projects with GLCs); has attempted to reduce the crowding out effect and generate better
Khazanah Nasional Berhad | International Forum of Sovereign Wealth Funds. “Khazanah Nasional Berhad | International Forum of Sover eign Wealth Funds.” www.ifswf.org. Accessed March 10, 2022. https://www.ifswf.org/member-profiles/khazanah-nasional. Ibid. The Khazanah Report 2019: Growing Malaysia’s Long Term Wealth. (Kuala Lumpur, Malaysia: Khazanah Nasional Berhad, 2020). Yeap, Cindy. “Cover Story: Khazanah Strives towards ‘Advancing Malaysia.’” The Edge Markets. www.theedgemarkets.com, February 3, 2022. Accessed March 10, 2022, https://www.theedgemarkets.com/article/cover-story-khazanah-strives-towards-advancing-malaysia. Kana, Ganeshwaran. “Banking on a Refreshed Strategy | The Star.” The Star. www.thestar.com.my, March 3, 2022. https://www.thestar.com. my/business/business-news/2022/03/03/banking-on-a-refreshed-strategy Our Portfolio | Khazanah Nasional Berhad |. “Our Portfolio | Khazanah Nasional Berhad |.” www.khazanah.com.my. Accessed March 10,
Dixon, Adam D. “The Strategic Logics of State Investment Funds in Asia: Beyond Financialisation.” Journal of Contemporary Asia 52, no. 1 (2022): 127-151. Ibid. Lai, Jikon. “Khazanah Nasional: Malaysia’s treasure trove.” Journal of the Asia Pacific Economy 17, no. 2 (2012): 241-42. Dixon, Adam D. “The Strategic Logics of State Investment Funds in Asia: Beyond Financialisation.” Journal of Contemporary Asia 52, no. 1 (2022): 127-151. Board of Directors | Khazanah Nasional Berhad |. “Board of Directors | Khazanah Nasional Berhad |.” www.khazanah.com.my. Accessed March 10, 2022. https://www.khazanah.com.my/who-we-are/board-of-directors/. Lai, Jikon. “Khazanah Nasional: Malaysia’s treasure trove.” Journal of the Asia Pacific Economy 17, no. 2 (2012): 239 Ibid. Ibid. Yeap, Cindy. “Cover Story: Khazanah Strives towards ‘Advancing Malaysia.’” The Edge Markets. www.theedgemarkets.com, February 3, 2022. Accessed March 10, 2022. https://www.theedgemarkets.com/article/cover-story-khazanah-strives-towards-advancing-malaysia. Ibid
returns for the state; and has attempted to transform majority owned GLCs (such as Malaysian Airlines and the CIMB banking group) into regional champions . This indicates its considerably more hands-on management approach of the GLCs that it has equity in as opposed to Temasek’s hands-off approach. However, this appears to be in order to reform these companies and improve their return on investment rather than purely politically motivated interference, and has generally been successful and well received in the market . Throughout this process, the Malaysian Government has continued to exercise its shareholder power in Khazanah to promote economic growth and broader government policies and maintains an active role in management (e.g. the Prime Minister of Malaysia is the Chairman of the Board of Khazanah ). However, this lack of independence has limited Khazanah’s potential growth. It has been tapped to fund strategic projects that require large capitalisation and long periods of gestation including infrastructure, utilities, the national automotive sector , etc. and not necessarily the most profitable investments. It has also been selected to inject capital into ailing firms in exchange for equity or full ownership – for example, it was selected to nationalise the struggling Malaysian Airlines in 2014. It also did not receive financial assistance to distribute amongst hard-hit assets during the COVID pandemic, as Temasek did, reducing its operating profit considerably and contributing to a lower annual growth rate than Temasek.
Chapter 06: Reforming SOEs; Lessons from Asia
Khazanah Manager Model
Malaysian government
Active direction. PM is chairman of Board. Khazanah has been Ministry of finance required to make investments that align with Malaysian Government policies. Has been required to finance capital intensive long-term projects
Board
Management
Exercises shareholder influence to reform companies and increase ROI Majority state-owned GLCs are transformed into regional champions Hands-on management
Portfolio companies
Commercial fund Grow financial assets and diversify revenue for the nation
- Ant Group
- Astro Malaysia Holdings Berhad
- Axiata Group Berhad
- Bank Muamalat Malaysia Berhad
- Cement Industries of Malaysia
- Cenergi SEA Sdn Bhd
- Cenviro Sdn Bhd . CIMB Group Holdings Limited
- IHH Healthcare Berhad
- M+S Pte Ltd
- Monoluxury Sdn Bhd
- ReGen Rehabilitation International Sdn Bhd
- Sun Life Malaysia Assurance Berhad
- The Holstein Milk Company Sdn Bhd
- UEM Edgenta Berhad
- UEM Group Berhad
- UEM Sunrise Berhad
Putrajaya Committee on GLC high performance (2005-) MOF, PM, and heads of governmentlinked investment companies to transform GLCs
Executive Committee Responsible for fulfilling Board’s mandate to govern Audit & Risk Committee the company. Specifies funding, investment risk Nomination and
appetite, etc Remuneration Committee
Strategic fund Hold strategic assets that bring long term economic benefit
- Iskandar Investment Berhad
- Malaysia Airports Holdings Berhad
- Malaysia Aviation Group Berhad (Malaysian Airlines)
- Medina Iskandar Malaysia Sdn Bhd
- PLUS Malaysia Berhad
- Southern Marine Developmenr Sdn Bhd
- Sunway Iskandar Sdn Bhd
- Telekom Malaysia Berhad
- Tenaga International Berhad
- Themed Attractions Resorts and Hotels Sdn Bhd
Figure 12
Chapter 06: Reforming SOEs; Lessons from Asia
6.3:
Lessons Learnt and Privatisation
Experiences
6.3.1: China
With focus on improving the efficiency and productivity of the large state owned assets which would affect the growth of the economy and result in mounting debt levels, China adopted a policy named “zhuada fangxiao”, which translates to “grasp the big and release the small.” The objective of this policy was to reduce the number of small SOEs in operation. This resulted in privatisation and the merging of small enterprises which had heavy expenditure levels. Subsequently, the State Owned Supervision and Administration Commission (SASAC) was set up in 2003 as a holding company to monitor the now-divested state owned enterprises to enhance the performance of the SOEs and reduce the colossal burden on the government. It is a direct minister-level organisation under the State Council, performing investor responsibilities, supervising and managing state owned assets of enterprises under the Central Government. SASAC holds the responsibility of supplementing the value of state owned assets, evaluating the performance and supervising the audits of the state owned enterprises. If any state owned entity needs to be restructured, the SASAC will introduce reforms such as establishing new best practices or introducing corporate governance ethics. SASACholds companies’ practice of satisfactory levels of governance in comparison to other peer organisations. Officials of these companies are contracted based on their performance and they are given detailed dividend targets to achieve. Measures such as subsidiary companies being listed in order to introduce private supervision (partial privatisation measures), as well as foreign investors being given opportunities to invest in SOEs, have been introduced thereby improving corporate governance and ensuring minority shareholder protection. Yet the State overlooks and closely monitors the private players on stock price dynamics, media publications
Guluzade, Amir . “How Reform Has Made China’s State-Owned Enterprises Stronger” World Economic Forum. www.weforum.org, May 21,
- https://www.weforum.org/agenda/2020/05/how-reform-has-made-chinas-state-owned-enterprises-stronger/.
Kim, Kunmin, and Natarajan Panchanatham. “Reform and privatization of state-owned enterprises in India.” In Reforming State-Owned Enterprises in Asia, pp. 157-168. Springer, Singapore, 2021.
and lawsuits. Further, it overlooks the wages and salary payments of the enterprises under its supervision and formulates regulatory policiesespecially for income distribution among high level executives. SASAC is vested with the power to appoint officials through a corporate executives selection system for SOEs under its supervision and monitors their performances. Incentives are given through rewards based on their performance and it takes necessary legal action against misconduct. SASAC strictly enforces the laws and regulations that pertain to SOEs on matters of standards, asset management, audits and inspection of the output. It also manages the local state owned assets and their budget operations including accounts under relevant legal provisions.
6.3.2: India
Privatisation in India has four main segments :
1. Delegation – the government manages the
ownership while the private sector takes part in the process of delivering goods and services. Such delegation attempts are made through contracts, franchises, leases or grants.
2. Divestment – the government sells the majority
stake of the SOE to private entities. The state will remain in ownership as a minority stakeholder.
3. Displacement – deregulation measures will allow
private entities to enter the market/industry of the SOE. This will eventually allow the private entities to displace the public enterprise step by step.
4. Disinvestment – the government sells the public
enterprise partially or entirely to private entities. In March 2022, the Union Cabinet in India approved the creation of the National Land Monetisation Corporation (NLMC). It was known as a Special Purpose Vehicle for monetisation of assets belonging to Central Public Sector Enterprises (CPSEs) and other government agencies. It necessarily means transferring the revenue rights of surplus, underused or unused land assets to a private entity for a specified time period. NLMC is wholly government owned with initial authorised share capital of Rs 5,000 crore and paid-up share capital of Rs 150 crore.
Press Information Bureau Delhi. “Cabinet Approves Setting up of National Land Monetization Corporation as a Special Purpose Vehicle (SPV) for Undertaking Surplus Land Monetization.” pib.gov.in, March 9, 2022. https://pib.gov.in/PressReleasePage.aspx?PRID=1804287.
Chapter 06: Reforming SOEs; Lessons from Asia
This process would enable the efficient use of underused and unused assets and generate revenues through private sector investments and economic activities, finally boosting the financial resources of the local economy. CPSEs that were closed down or those under strategic disinvestment would be able to unlock their values. NLMC will also act as an advisory body for government entities including CPSEs to identify their assets and monetize them efficiently to generate maximum benefits. For ongoing CPSEs and listed CSPEs under strategic disinvestment, NLMC will undertake an agency function for land asset monetization. Furthermore, it will assist the government with technical know-how on asset monetisation. The board of directors will consist of senior government officials and management and operational experts. The Chairman and nongovernmental officials will be appointed on a merit basis . Prime Minister Modi’s government has pushed for privatisation of SOEs in India, highlighting the losses made by large public sector enterprises. In a recent endeavor, India successfully privatised the lossmaking national airline carrier, Air India, by selling it back to its original owners, The Tata Group. The airline was sold in a $2.4 billion equity and debt deal, ending a years-long struggle for the Modi-led government to divest the debtridden airline .
Drishti IAS. “National Land Monetisation Corporation (NLMC).” www.drishtiias.com, March 30, 2022. https://www.drishtiias.com/to-the-points/ paper3/national-land-monetisation-corporation-nlmc. The Times of India. “PM Modi Bats for Privatisation, Says ‘Govt Has No Business to Be in Business’.” timesofindia.indiatimes.com, February 24,
be-in-business/articleshow/81192074.cms. Chowdhury, Anirban. “Air India’s Glory Days Offer an Insight into How It Can Be Turned around” The Economic Times. m.economictimes. com, October 9, 2021. https://m.economictimes.com/news/company/corporate-trends/air-indias-glory-days-offer-an-insight-into-how-it-can-beturned-around/articleshow/86882451.cms The Hindu BusinessLine. “How Air India Lost Sight of Its Flight Path” www.thehindubusinessline.com, October 10, 2021. https://www.thehin dubusinessline.com/opinion/how-air-india-lost-sight-of-its-flight-path/article36929439.ece. Ibid. Chowdhury, Anirban. “Air India’s Glory Days Offer an Insight into How It Can Be Turned around” The Economic Times. m.economictimes. com, October 9, 2021. https://m.economictimes.com/news/company/corporate-trends/air-indias-glory-days-offer-an-insight-into-how-it-can-beturned-around/articleshow/86882451.cms. Seli, Yeshi. “Merger of Air India and Indian Airlines Led to Downfall of National Carrier, Says Scindia” The New Indian Express. www.newindi anexpress.com, March 23, 2022. https://www.newindianexpress.com/nation/2022/mar/23/merger-of-air-india-and-indian-airlines-led-to-down fall-of-national-carrier-says-scindia-2433423.html. The Hindu BusinessLine. “How Air India Lost Sight of Its Flight Path” www.thehindubusinessline.com, October 10, 2021. https://www.thehin dubusinessline.com/opinion/how-air-india-lost-sight-of-its-flight-path/article36929439.ece.
Box article 3 –
Air India and SriLankan Airlines
Founded in 1932 by the Tata group, Air India was nationalised in 1953. The trouble started in the 90s with controversial leasing contracts as well as an attempt to buy peace with unions backfiring when pilots and aircraft maintenance engineers (AMEs) demanded that they be paid US equivalent salaries in rupees, robbing Air India of its competitiveness. The merger between Air India and Indian Airlines was said to be a major cause of the failure that India’s national carrier experienced.
The public sector airlines were merged in 2006-07 to facilitate better synergies of their resources, yet this merger remained only on paper with resources, aircraft, and staff remaining separated. Prior to this merger, both airlines were somewhat profitable but the merger, combined with the ill-advised purchase of 111 aircraft at a cost of $11 billion at the behest of corrupt government officials, led to massive debt.
The lack of proper financial control and poor client-orientation made things even worse. There was an absence of continuity or accountability of the top leadership. Those who were put in charge of running Air India had little experience in aviation and were therefore incompetent.
Chapter 06: Reforming SOEs; Lessons from Asia
Air India, which was losing $ 3 million a day on average (over $ 1 billion per year) was sold back to Tata Group in October 2021. In exchange for a $2.4 billion equity and debt deal, the Indian government relinquished 100% of Air India’s shares, ending years of failed attempts to sell the loss-making airline. Initial attempts at privatisation failed due to opposition by trade unions and the reluctance of potential bidders to take on 70% of the airline’s debt whilst being allowed to hold only 70% of their shares.
In many ways, SriLankan Airlines bears similarity to Air India. Almost continuously throughout its history, SriLankan Airlines has experienced politicisation, corruption and mismanagement. Air Lanka, as it was then known, underwent a partial privatisation in 1998 with Emirates obtaining a 40% stake in it and the government retaining a majority stake in the airline. They later increased this to 43.6%. That same year, Air Lanka was rebranded as SriLankan Airlines.
Due to a now infamous incident, the carrier decided not to renew their management contract with the government in 2008 because the government wanted greater day-to-day control over operations and in 2010, Emirates sold their stake in SriLankan Airlines back to the government. The nepotistic hiring of the SOE’s chairman and grossly overpaid management were just a few of the other issues that plagued the airline.
Samarajiva, Rohan. “Air India Sold; Privatise SriLankan Now.” Advocata Institute | Sri Lanka | Independent Policy Think Tank. www.advocata. org, October 11, 2021. https://www.advocata.org/commentary-archives/2021/10/11/air-india-sold-privatise-srilankan-now. BBC News. “Air India: Tata Group Takes over Loss-Making National Carrier” www.bbc.com, January 27, 2022. https://www.bbc.com/news world-asia-india-60150531. The Economic Times. “Air India Finds a New Address: Chronology of Air India Privatisation.” economictimes.indiatimes.com, January 27, 2022. https://economictimes.indiatimes.com/industry/transportation/airlines-/-aviation/air-india-finds-a-new-address-chronology-of-air-india-privati sation/articleshow/89157779.cms. Ondaatjie, Anusha, and Asantha Sirimanne. “Sri Lanka Buys Emirates’ Stake in SriLankan Airlines.” Bloomberg BusinessWeek. web.archive.org, July 7, 2010. https://web.archive.org/web/20100710231520/http://www.businessweek.com/news/2010-07-07/sri-lanka-buys-emirates-stake-insrilankan-airlines.html. Advocata Institute, “The State of State Enterprises in Sri Lanka 2019. Systemic Misgovernance: A Discussion.” Colombo 07: Advocata Institute, Colombo Telegraph. “The Sad State Of SriLankan Airlines: From Rs. 4.4 Billion Profit To Rs. 107 Billion Loss In 7 Years.” www.colombotele graph.com, March 25, 2016. https://www.colombotelegraph.com/index.php/the-sad-state-of-srilankan-airlines-from-rs-4-4-billion-profit-to-rs107-billion-loss-in-7-years/. SriLankan Airlines Annual Report FY2020/2021. (Katunayake: SriLankan Airlines Limited, 2021.)
The result of all of this was that Sri Lanka’s national carrier went from earning a profit of Rs. 4.4 billion in 2008 to making a loss of Rs. 49 billion in 2021. That is more than Rs.130 million of taxpayer money being lost each day. With such a financial strain being placed on Sri Lanka’s already beleaguered economy, there appears to be no choice but to follow the path of Air India and privatise.
CHAPTER 07
COPE
INQUIRIES INTO SOES
Box article 4 –
Lanka Coal Company Pvt. Ltd
Lanka Coal Company (Private) Limited was incorporated under the Companies Act No 07 of 2007 and their main function is to procure and supply coal for coal-fired thermal plants in Sri Lanka. 60% of the company is owned by the Ceylon Electricity Board, 20% by the treasury and the Sri Lanka Port Authority and Ceylon Shipping Corporation each own 10%. The COPE report states that Lanka Coal Company Pvt. Ltd has not followed the procedure with regard to coal procurement, with there being significant issues with the bidding process. Inexperienced institutions being permitted to place bids and bidding deadlines being altered erratically were some of the problems mentioned. Another issue that was raised was the decision to use spot contracts or term contracts based on profitability as opposed to policy. The approval of procurements that had not been signed by the technical evaluation committee was also brought up by the committee. It was also discovered that a loss of Rs.1.1 billion had been incurred due to the procurement committee not specifying the exact quantity of coal required beforehand. The Lakvijaya Power Plant which was said to add 900MW to the national grid only contributes 810MW, with each of the plants’ three generators taking up 30MW for its own usage. The COPE report inquires whether the decision to purchase coal through the open market instead
First Report of the Committee on Public Enterprises: First Session. (Colombo, Sri Lanka: the Parliament of Sri Lanka, 2021.) Daily FT. “COPE Discovers Losses of Rs. 1.1 b Due to Ad Hoc Purchase of Coal by Lanka Coal Company.” www.ft.lk, October 8, 2020. https:// www.ft.lk/front-page/COPE-discovers-losses-ofRs-1-1-b-due-to-ad-hoc-purchase-of-coal-by-Lanka-Coal-Company/44-707188. First Report of the Committee on Public Enterprises: First Session. (Colombo, Sri Lanka: the Parliament of Sri Lanka, 2021.) Ibid. Daily News. “One Billion Loss on the Purchase of Coal.” www.dailynews.lk, October 7, 2020. https://www.dailynews.lk/2020/10/07/lo cal/230838/one-billion-loss-purchase-coal First Report of the Committee on Public Enterprises: Second Session. (Colombo, Sri Lanka: the Parliament of Sri Lanka, 2022. First Report of the Committee on Public Enterprises: Second Session. (Colombo, Sri Lanka: the Parliament of Sri Lanka, 2022.)
of carrying out purchases through the Shipping Corporation would be better for profitability. Heavy losses of Rs. 1,100 million that were incurred due to the purchase of 3 barges that were then left idle before being handed over to the Sri Lanka Navy were also addressed by COPE.
Box article 5 –
Lanka Mineral Sands Ltd.
Lanka Mineral Sands Ltd is the successor to Ceylon Mineral Sands Corporation which was established in 1957 under the Industrial Corporation act. In 1992, this corporation was converted to Lanka Mineral Sands Limited as a fully state-owned company. The main function of this company is to engage in the mining, processing and exporting of heavy mineral beach sands.
The COPE report for 2020/2021 inquired about Lanka Mineral Sands Ltd. which sold 85,000 metric tons of ilmenite to a third-placed bidder and not the highest bidder. According to the press release, the third-placed bidder had paid USD147 per ton while the highest bidder had offered USD165 per ton. The sale had also been approved by a Cabinet sub-committee. The members of COPE who brought this issue up stated that the officials of the
Chapter 07: COPE inquiries into SOEs
Lanka Mineral Sands Limited have taken steps to mislead the Cabinet of Ministers.
The committee also looked at the reduction in sales in 2020 compared to the total sales in 2018 and 2019. It was revealed that 85,000 metric tons of ilmenite, which were sold to a buyer in October 2020, are still stored in their Pulmudai warehouse, causing financial strain to the company. Officials of Lanka Mineral Sands Limited said that the deadline for the removal of the consignment has been extended due to the prevailing Covid situation. It was also disclosed that payments had been made only for 65,000 metric tons from this stock and payment for another 20,000 metric tons had yet to be recovered.
Box article 6 –
Sri Lanka Insurance Corporation (SLIC)
The Sri Lanka Insurance Corporation (SLIC) represents three issues that plague SOEs in Sri Lanka; poor corporate governance, inefficiency and corruption that arise from a lack of transparency and accountability.
The problem of poor corporate governance is demonstrated through the unwillingness of SLIC to separate its long-term insurance business and the general insurance business as per the amendment made to the Insurance Act, No. 3 of 2011. The deadline for this segregation of business functions was 11 February 2015 but SLIC has still not complied with this law. According to the 2020
Parliament of Sri Lanka – Committee News. “COPE Directs to Investigate the Sale of 85,000 MT of Ilmenite Immediately and Submit a Report within a Month.” www.parliament.lk, March 23, 2021. https://www.parliament.lk/committee-news/view/2096. Sirimanna, Bandula. “Sri Lanka Ilmenite Tender Flaws Expose Corruption and Fraud.” The Sunday Times, Sri Lanka. www.sundaytimes.lk, April 4, 2021. https://www.sundaytimes.lk/210404/business-times/sri-lanka-ilmenite-tender-flaws-expose-corruption-and-fraud-438731.html. Parliament of Sri Lanka – Committee News. “COPE Directs to Investigate the Sale of 85,000 MT of Ilmenite Immediately and Submit a Report within a Month.” www.parliament.lk, March 23, 2021. https://www.parliament.lk/committee-news/view/2096 First Report of the Committee on Public Enterprises: Second Session. (Colombo, Sri Lanka: the Parliament of Sri Lanka, 2022.) Sri Lanka Insurance Annual Report 2020. (Colombo, Sri Lanka: Sri Lanka Insurance Corporation Limited, 2021). Daily FT. “Liabilities Rise Sky-High for Hyatt Following Court Order.” www.ft.lk, February 10, 2020. https://www.ft.lk/Front-Page/Liabilities-risesky-high-for-Hyatt-following-Court-order/44-695389. Echelon. “Colombo Hyatt’s Grand Scale Surpassed by Its Grander Opaqueness.” www.echelon.lk, October 8, 2015. https://www.echelon.lk/ colombo-hyatts-grand-scale-surpassed-by-its-grander-opaqueness/. Rizvi, Zahida. “Ousted Grand Hyatt Investors Demand €9m.” The Morning – Sri Lanka News. www.themorning.lk, May 9, 2021. https://www. themorning.lk/ousted-grand-hyatt-investors-demand-e-9-m/.
SLIC annual report, the company is “currently in discussion with the relevant ministries to agree on a methodology to satisfy the legal framework”.
SLIC is also dealing with a number of inefficiencies as well as incidences of corruption at the hands of its subsidiary Canwill Holdings.Canwill Holdings (Pvt) Ltd., in which SLIC has a 45.95% stake, is in the business of managing/ investing in hotel projects. Canwill Holdings (Pvt) Ltd., in turn has a 100% stake in Helanco Hotels & Spa (Pvt) Ltd.and Sinolanka Hotels & Spa (Pvt) Ltd. Sinolanka Hotels & Spa (Pvt) Ltd is the owner of the Grand Hyatt Colombo project.
Several inconsistencies with regard to the awarding of a contract to interior work specialists resulted in arbitration followed by court action, which Sinolanka lost. Delays in the construction process have resulted in increased costs.
An investigative audit of Canwill Holdings has revealed ‘lapses, corruption and irregularities’ which led to “corporate funds being vulnerable to fraud and waste as a result of poor oversight, negligence and violation of good governance.” The Grand Hyatt Hotel project, which was said to involve fraud amounting to billions in taxpayer money, was offered various tax concessions, including a waiver on Value Added Taxes, the Ports and Airport Development Levy, and Customs Duty. In addition to an income tax waiver, exemption on withholding taxes was further granted under the grounds of certain conditions for foreign loans, technical fees for consultants, and any other payments made to the Hyatt Hotel Corporation in the US, or its subsidiaries.
Chapter 07: COPE inquiries into SOEs
In the process of procuring steel for the project, a bidder offered steel at Rs 114,897 per tonne and was selected, overlooking a bid of Rs 110,160 per tonne. The audit revealed email correspondence that suggested the supplier of steel for the project was pre-selected and that the corruption led to a loss of Rs.16.426 million.
Helanco Hotels and Spa (Pvt) Ltd, a subsidiary of Canwill Holdings, is also dealing with issues of corruption. The transfer of Rs. 500 million and Rs. 3.5 billion to a Helanco bank account prior to obtaining board approval was one such issue highlighted by an FCID ‘B’ report.
Box article 7 –
Malpractices in the process of calling for
bids for the Central Expressway project
phase III
In March 2021, the Committee on Public Enterprises (COPE) reported the findings of its special inquiry into the Central Expressway project and its procurement activities. The committee finds that unwarranted intervention was made into the bid process by the Cabinet Committee on Economic Management (CCME), violating the provisions of the public procurement guidelines of
The Auditor General’s Special Audit Report on the Feasibility Study of the Central Expressway Project and the Procurement Activities for the Project found that the procedure for selecting a consultant and a contractor for the phase I, II and III of the Central Expressway violated the Public Procurement Guidelines of 2006 as it failed to follow a competitive bidding process.
Kannangara, Nirmala. “Grand Hyatt Case EPF Funds Misused in Hotel Project – Expose.” Daily Mirror. www.dailymirror.lk, November 14, 2017. https://www.dailymirror.lk/expose/Grand-Hyatt-case-EPF-funds-misused-in-hotel-project/333-140299. Ibid.
In 2013, an agreement was reached between the Road Development Authority (RDA) and the Metallurgical Ground Corporation (MCC) – a consortium of Chinese construction firms, for MCC to undertake the designing, funding, construction and implementation of a part of the section 3 of the Northern Expressway.
In 2014, the cabinet had approved the award of a contract worth Rs. 48.2 billion to MCC to construct a part of the section 4 of the Central Expressway as well. However, the government was not able to sign the loan agreement made with the EXIM Bank at the time, automatically terminating the contract and requiring the government to pay MCC all the expenses it had thus incurred. However, the government was not able to pay these expenses and had therefore the cabinet approved the award of a contract worth Rs 158 billion for the first part of the Kadawatha-Meerigama project to MCC.
The report concludes that the cost of the Central Expressway has been badly affected due to unusual delays and due to the informal manner of decision making, which failed to follow procurement guidelines.
First Report of the Committee on Public Enterprises: First Session. (Colombo, Sri Lanka: the Parliament of Sri Lanka, 2021.)
CHAPTER 08
WAY
FORWARD
Sri Lanka’s economy is in a critical
The losses of SOEs have long been recognised as a source of macroeconomic instability for Sri Lanka,
state, and has now devolved into a
with losses being particularly weighty in the energy
political crisis. Resolving the economic
sector. Certain entities, including the CPC, CEB and
crisis is a difficult task, but resolving
SriLankan Airlines, have been noted as needing urgent reform to propel them from loss-making to profit-
it in the midst of political turmoil
generating organisations. Allowing the accumulation
is monumentally challenging. In
and continuance of debt making practices would only
particular, the debt problem faced
enrich the process of circular debt, pushing Sri Lanka into a deeper pit of deficit. The objectives of SOE reforms
by Sri Lanka has become a grave
are two fold; to improve public finances and thereby
issue for the nation. Now reaching
reduce the budget deficit and public debt and to improve
unsustainable levels, Sri Lanka faces
the productive use of the nation’s resources to drive
the dilemma of needing to close
sustainable and inclusive economic growth.
deficits while also being hemmed in by
However, reforms are feared because the public does
revenue and expenditure. It is within
not understand why they are needed. The government
this setting that the reformation of
must have a good communication strategy to explain why the reforms are necessary and what their impact
state enterprises as a feasible, and
will be. The goal should not be to convince everyone,
relatively easier, option of tackling the
but to convince the majority. Proper sequencing of
debt levels of the country is proposed.
SOE reforms, along with wider economic reforms to improve export sector performance and private sector growth, are necessary to ensure buy-in and a smoother transition.
Previous episodes of SOE reforms have sometimes attracted controversy, but the country has arrived at a unique juncture of public consensus on the need for political, social and economic reforms for Sri Lanka. There might be some compromise needed to ensure progress, but the direction is clear.
As methods of successfully implementing SOE reforms to achieve both sustainable public finance and overall economic efficiency, the measures of reform suggested by the Advocata Institute include corporate restructuring, introduction of competition, improvements in regulatory frameworks where necessary, and divestiture and contracting out of services where possible. The proposed steps for critical reform include recognition and consolidation of financial support for SOEs; enforcing budget constraints and better governance of firms; increasing output prices to match the minimum of cost
Chapter 08: Way forward
recovery levels or allowing for market pricing; permitting private entry into state monopolised markets; the divestiture, downsizing or closure of unviable entities; placing all commercial entities under a holding company; the financial outturn and dependence of such entities on state funds being reviewed, and subsidies which can be identified as commercial ventures being shortlisted for disposal. The need for a privatisation agency is further necessitated due to advantages including reduction in drain of government resources, generation of new sources of government revenue and improvement of efficiency in the economy by making it responsive to market forces.
The identified reform of elimination of fiscal imbalances and misallocation of resources through market pricing products and introducing competition is determined as being most crucially relevant for entities in the energy sector. As such, CPC, CEB and Litro Gas must structure prices on a cost recovery basis and entrenched regulations should be relaxed to allow private participation to improve industry efficiency. However, in repricing, the negative impact on the poorest sections of society should be minimised and the fact that consumers may be expected to pay higher prices for higher world prices but not for higher costs resulting from inefficiency, waste or corruption should be noted.
Further to the proposed reforms, Advocata also proposes critically evaluating the need for government intervention in SOEs. Prior to the continued intervention the government should be able to articulate and assess the extent to which achievement of economic and equity objectives have been attained through ownership in the SOE. Provided that the government is not able to do so, it should withdraw from state intervention in activities of the SOE.
The need for robust, independent institutions has been a notable theme in the lead up to and unfolding of Sri Lanka’s economic crisis. Institutions that function within a set mandate sans political intervention and influence where possible are vital to ensure long-term economic growth and prosperity, both equitably and sustainably, for Sri Lankans.
ANNEXURE
METHODOLOGY
FURTHER EXPLAINED
Why were these indicators chosen?
a. Financial Indicators
Financial indicators are statistics extensively used to monitor soundness, stability and performance. Data on financial indicators were gathered from different sources such as Annual Reports of particular state owned enterprises, Performance Reports of the Public Enterprise department and the Annual Reports of the Ministry of Finance.
In order to evaluate the financial performance, quantitative data such as Turnover, Total Assets, Total Liabilities, Profit/Loss and Total Equity were used.
Turnover/Revenue
- Revenue refers to the value of output sold, that
is the number of units times the price per unit. Average revenue is revenue per unit, that is total revenue divided by the amount of output sold. Average revenue is therefore equal to price per unit.
Profit/Loss
- Profit is the residual amount after expenses
(including capital expense adjustments, where appropriate) have been deducted from income. If expenses exceed income the residual amount is a loss.
Glossary of Industrial Organisation Economics and Competition Law, compiled by R. S. Khemani and D. M. Shapiro, commissioned by the Directorate for Financial, Fiscal and Enterprise Affairs, OECD, 1993. Accounting Standards Committee, The Conceptual Framework for Financial Reporting. (Colombo, Sri Lanka: Sri Lanka Accounting & Auditing Standards Committees) Ibis Ibis Ibis
Total Assets
- An asset is a resource controlled by the entity as
a result of a past events and from which future economic benefits are expected to flow to the entity
Total Liabilities
- A Liability is a present obligation of the entity
arising from past events, the settlement of which is expected to result in an outflow from the entity of resources embodying economic benefits .
Total Equity/Capital
- Equity is the residual interest in the assets of the
entity after deducting all its liabilities.
Return on Assets
- The term return on assets (ROA) is a financial
ratio that indicates how profitable a company is in relation to its total assets. Corporate management, analysts, and investors can use ROA to determine how efficiently a company uses its assets to generate a profit. The metric is commonly expressed as a percentage by using a company’s net income and its average assets.
Annexure : Methodology Further Explained
b. Governance Indicators
Governance indicators refers to the qualitative data used to assess the dual objectives of state-owned enterprises; the commercial objective and the public policy objective. Such indicators ensure corporate governance practices and the social responsibility of public enterprises. It further evaluates the SOE’s compliance to the legal and the regulatory structures and the reliability of the public services provided.
The research included Annual Reports, Auditing Standards, responses from Right To Information inquiries and Accessibility of information as nonfinancial indicators. Each of these indicators consist of sub-indicators which provide a comprehensive understanding of regulatory guidelines and corporate ethics of State Owned Enterprises.
Annexure : Methodology Further Explained
IndicatorSub – Indicator
Justifi cation As per the guidelines of the
Annual
Year of the Public Enterprises Department
Report
most recent Annual Report (PED), public enterprises are available onlinedirected to publish their Annual Reports on their respective websites “within 150 days from the end of the fi nancial year.” “In terms of the Constitution,
Have the Annual Reports Parliament has full control of public fi nance and therefore
for the last public enterprises are subject to
fi ve years been tabled in parliamentary control.” Parliament?
“It is absolutely essential that
Does the Annual Report Annual Reports should be prepared in a timely manner,
include the with all relevant disclosures
mandatory provisions set that would enable interested out in the PED parties to form a judgement on the performance and future
guidelines? prospects of the enterprise.” The specifi c mandatory information includes: a) “Key Business (activities)”; b) “Risk assessment and mitigating strategies”; c) ”Analysis on fi nancial and operational performance”; d) “Management’s discussions and analysis”; e) “Statement on Economic Value Added”; f) “Financial Statements and Audit Report.” “The purpose of the Sri Lanka
Auditing
Is the Audit Auditing Standard (SLAuS) is to
StandardsClean/ establish standards and provide
Qualifi ed/ guidance on the form and
Disclaimer? content of the auditor’s report issued as a result of an audit performed by an independent auditor of the fi nancial statements of an entity. Much of the guidance provided can be adapted to the auditors’ reports on fi nancial information, other than fi nancial statements.”
Department of Public Enterprise, “Guidelines for the Preparation of Annual Reports: Annexure IV”, p.5. (Colombo 01, Sri Lanka: Ministry of Finance). Ibis. Department of Public Enterprise, “PED Guidelines”, p.25. (Colombo 01, Sri Lanka: Ministry of Finance). Department of Public Enterprise, “Guidelines for the Preparation of Annual Reports: Annexure IV”, p.2. (Colombo 01, Sri Lanka: Ministry of Finance). Sri Lanka Auditing Standard 700, “The Auditor’s Report on Financial Statements.” p. 2. Ibis., p.7.
Score
Code Description Available= 8.33Latest available Annual Report for
Partially=4.165Latest available Annual Report for the years 2019, 2018 Not Available=0Latest available Annual Report for years before 2017 Yes=8.33
Annual Reports available for past 5 years (2020, 2019, 2018, 2017, 2016) Partially=4.165Annual Reports available for past 14 years No=0
Annual Reports available only for years before 2016 Yes=8.33
All requirements have been met. Partially=4.165Some requirements have been met. (A minimum of one and a maximum of fi ve of the listed guidelines have been met). No=0
None of the requirements have been met.
Unqualifi ed=25“An unqualifi ed opinion should be expressed when the auditor concludes that the fi nancial statements give a true and fair view (or are presented fairly, in all material respects) in accordance with the identifi ed fi nancial reporting framework. An unqualifi ed opinion also indicates implicitly that any changes in accounting principles or in the method of their application, and the eff ects thereof, have been properly determined and disclosed in the fi nancial statements.”
Annexure : Methodology Further Explained
IndicatorSub – Indicator
Justifi cation
“Every public authority shall
Right to
Is the for the purpose of giving eff ect
Informationinformation pertaining to to the provisions of this Act, the RTI offi cer appoint, within three months of available on the the date of coming into operation of this Act, one or more offi cers
website? as information offi cers of such public authority and a designated offi cer to hear appeals.” “Every public authority shall display in a conspicuous place within the offi cial premises and on a website of such public authority if any, a notice specifying– (a) contact details of the Commission and the members of the Commission;(b) contact details of the information offi cer;(c)contact details of the designated offi cer; (d)fees to be charged for obtaining any information from such public authority.”
Ibis., p.11. Ibis. Right to Information Act, No. 12 of 2016, p.16. Ibis., p. 20.
Score
Code Description Qualifi ed=12.5“A qualifi ed opinion should be expressed when the auditor concludes that an unqualifi ed opinion cannot be expressed but that the eff ect of any disagreement with management, or limitation on scope is not so material and pervasive as to require an adverse opinion or a disclaimer of opinion. A qualifi ed opinion should be expressed as being ‘except for’ the eff ects of the matter to which the qualifi cation relates.” Disclaimer=0“A disclaimer of opinion should be expressed when the possible eff ect of a limitation on scope is so material and pervasive that the auditor has not been able to obtain suffi cient appropriate audit evidence and accordingly is unable to express an opinion on the fi nancial statements.” Yes=12.5
Right to Information Offi cer details are available on the website. No=0
Right to Information Offi cer details are not available on the website.
Annexure : Methodology Further Explained
IndicatorSub – Indicator
Justifi cation
Score
Code Description Does the SOE “(1)An information offi cer shall, Yes=12.5 respond to a as expeditiously as possible No=0 RTI within the and in any case within fourteen working days of the receipt of a
timeframe specifi ed in the request under Section 24, make a decision either to provide the
Act? information requested for on the payment of a fee determined in accordance with the fee schedule referred to in Section 14(e) or to reject the request on any one or more of the grounds referred to in section 5 of this Act, and shall forthwith communicate such decision to the citizen who made the request.” Accessibilit y Does the SOE “The Board of Directors and
Yes=8.33
The SOE has a website. have a website?the management (of SOEs)
of No=0 are responsible for managing
Information the enterprise and are fi nally accountable to the public of Sri-Lanka as ultimate owners of public enterprises.” Furthermore,”Public enterprises are expected and encouraged to develop and maintain their own websites with all relevant data and information including salient fi nancial trends from the Annual Reports. Does the SOE “Public enterprises are expected Yes=8.33 website contain and encouraged to develop and Partially=4.165 maintain their own websites with
suffi cient No=0
organisational all relevant data and information including salient fi nancial trends
details? from the Annual Reports, that would enable any interested party to gain an insight of the objectives of the enterprise, its current performance and any information which would be of material interest to form an opinion of its operations and future trends.”
Ibis., p.18. Ibis., p. 11. Department of Public Enterprise, “PED Guidelines”, p.27. (Colombo 01, Sri Lanka: Ministry of Finance). Ibis.
Annexure : Methodology Further Explained
IndicatorSub – Indicator
Justifi cation
Score
Code Description The condition of suffi ciency will be fulfi lled if the website: a) Contains “all relevant data and information including salient fi nancial trends from the Annual Reports, that would enable any interested party to gain an insight of the objectives of the enterprise”; b) Contains information on “current performance”; c) Contains “any information which would be of material interest to form an opinion of its operations and future trends.” Does the SOE The Ministry of Finance
Yes=8.33 website contain Procurement Guidelines No=0 mandates that all public
tender and procurement enterprises must advertise a particular procurement notice
details? “at least in one widely circulated national newspaper, NPA website and other relevant websites where possible”. All
All Indicators
Data is not available. Indicators
Ibis. National Procurement Agency, “Procurement Agency 2006”, p. 16. (Colombo 01, Sri Lanka: Ministry of Finance, 2006).