Perceptions on Current Issues Faced by the Public Advocata | April 2019
Executive Summary
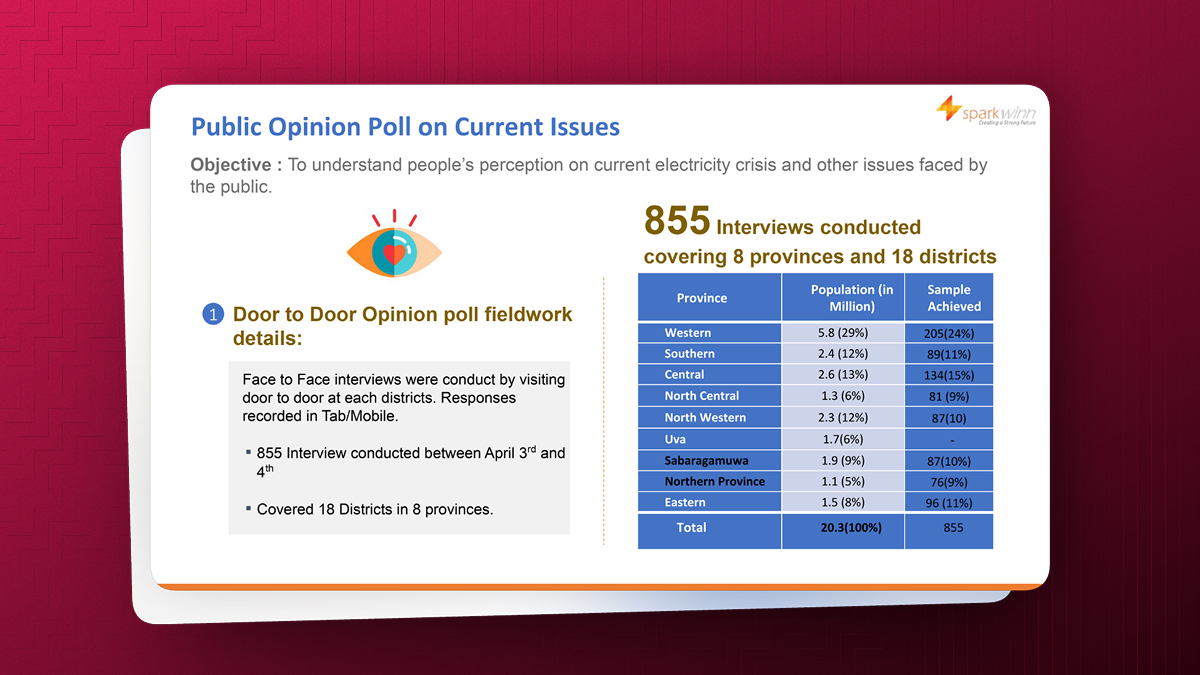
The poll was conducted to understand people’s perceptions of the current electricity crisis and other issues faced by the public.
Face-to-face interviews were conducted door-to-door, with responses recorded using tablets or mobile devices. A total of 855 interviews were conducted between the 3rd and 4th of April, covering 18 districts across 8 provinces.
Headline Findings
Measure
Result
Base
Losses of state-owned enterprises justified by services provided
Yes: 19% | No: 81%
851
Pay more for food to protect local industry
Yes: 43% | No: 57%
853
Pay more for construction material to protect local industry
Yes: 24% | No: 76%
848
Poll Methodology and Coverage
The poll used a door-to-door, face-to-face interview methodology. Respondents were interviewed within the selected districts and responses were recorded electronically.
Item
Details
Fieldwork dates
3–4 April
Interviews
855
Geographic coverage
18 districts in 8 provinces
Interview mode
Face-to-face, door-to-door
Response capture
Tablet / mobile
Provincial Sample Achieved
Province
Population
Sample achieved
Western
5.8 million (29%)
205 (24%)
Southern
2.4 million (12%)
89 (11%)
Central
2.6 million (13%)
134 (15%)
North Central
1.3 million (6%)
81 (9%)
North Western
2.3 million (12%)
87 (10%)
Uva
1.7 million (6%)
—
Sabaragamuwa
1.9 million (9%)
87 (10%)
Northern
1.1 million (5%)
76 (9%)
Eastern
1.5 million (8%)
96 (11%)
Total
20.3 million (100%)
855
Districts Covered
District
Sample achieved
Share
Colombo
83
10%
Gampaha
39
5%
Kalutara
83
10%
Galle
42
5%
Matara
47
5%
Kandy
46
5%
Matale
44
5%
Nuwara Eliya
44
5%
Kurunegala
44
5%
Putlam
43
5%
Anuradhapura
40
5%
Polonnaruwa
41
5%
Ratnapura
15
2%
Kegalle
72
8%
Ampara
54
6%
Batticaloa
42
5%
Vauniya
29
3%
Total
855
100%
Sample Profile
The source presents the demographic profile of the 855 respondents as follows.
Profile
Category
Share
Gender
Male
51%
Female
49%
Age
18–25 years
17%
26–35 years
33%
36–50 years
28%
More than 50
22%
Education
Graduate / Professional
13%
GCE A/L Level
30%
GCE O/L Level
47%
Grade 6–9
4%
Up to Grade 5
6%
Socio-economic class
SEC A
16%
SEC B
29%
SEC C
36%
SEC D
15%
SEC E
5%
Monthly household income
Less than Rs. 30,000
27%
Rs. 30,001–70,000
62%
Above Rs. 70,001
11%
Base: All Respondents (855).
Finding 1 — State-Owned Enterprises
Question: Do you think the losses sustained by state-owned enterprises are justified given the services they provide?
Overall response: 19% said Yes, while 81% said No (base: 851 respondents).
Demographic group
Yes
No
Base
Male
17%
83%
427
Female
20%
80%
416
18–25 years
18%
82%
144
26–35 years
15%
84%
273
36–50 years
17%
82%
234
More than 50
23%
76%
159
SEC A
18%
82%
135
SEC B
22%
77%
244
SEC C
14%
86%
302
SEC D
21%
79%
125
SEC E
20%
80%
44
Response by Province
Province
Yes
No
Base
Western
12%
88%
204
Southern
6%
94%
88
Central
39%
61%
133
North Western
21%
79%
87
North Central
19%
81%
81
Sabaragamuwa
18%
82%
86
Eastern
18%
82%
96
Northern
22%
78%
76
Income group: Less than Rs. 30K — 17% Yes / 83% No (base 232); Rs. 30K–70K — 20% / 80% (base 524); Above Rs. 70K — 19% / 81% (base 80).
Finding 2 — Food Prices and Protection of Local Industry
Question: Would you pay more for your food, if it means that the local industry is protected?
Overall response: 43% said Yes, while 57% said No (base: 853 respondents).
Demographic group
Yes
No
Base
Male
38%
72%
427
Female
48%
52%
418
18–25 years
36%
64%
144
26–35 years
42%
58%
273
36–50 years
47%
53%
232
More than 50
46%
54%
159
SEC A
51%
49%
135
SEC B
43%
57%
245
SEC C
38%
61%
303
SEC D
43%
57%
125
SEC E
45%
55%
44
Response by Province
Province
Yes
No
Base
Western
48%
52%
205
Southern
22%
78%
89
Central
43%
57%
133
North Western
24%
76%
87
North Central
64%
36%
81
Sabaragamuwa
61%
39%
87
Eastern
41%
59%
96
Northern
33%
67%
76
Income group: Less than Rs. 30K — 32% Yes / 68% No (base 232); Rs. 30K–70K — 48% / 52% (base 526); Above Rs. 70K — 45% / 55% (base 80).
Finding 3 — Construction Material Prices and Protection of Local Industry
Question: Would you pay more for construction material, if it means that the local industry is protected?
Overall response: 24% said Yes, while 76% said No (base: 848 respondents).
Demographic group
Yes
No
Base
Male
22%
78%
428
Female
26%
74%
414
18–25 years
18%
82%
144
26–35 years
24%
78%
272
36–50 years
27%
72%
231
More than 50
27%
73%
158
SEC A
25%
75%
136
SEC B
25%
75%
243
SEC C
21%
79%
301
SEC D
27%
73%
123
SEC E
34%
66%
44
Response by Province
Province
Yes
No
Base
Western
18%
82%
205
Southern
15%
85%
88
Central
27%
73%
133
North Western
7%
93%
85
North Central
45%
55%
81
Sabaragamuwa
49%
51%
86
Eastern
16%
84%
94
Northern
21%
79%
76
Income group: Less than Rs. 30K — 23% Yes / 77% No (base 233); Rs. 30K–70K — 25% / 75% (base 520); Above Rs. 70K — 21% / 79% (base 81).
Cross-Cutting Observations
The strongest overall response is opposition to the losses sustained by state-owned enterprises being justified by the services provided: 81% answered No.
Respondents were more willing to accept higher food prices to protect local industry than higher construction-material prices: 43% versus 24% answered Yes.
For all three questions, the overall No response was larger than the Yes response.
For the food question, support for paying more was higher among females (48%) than males (38%).
For the construction-material question, the highest provincial Yes responses were reported in Sabaragamuwa (49%) and North Central (45%), while North Western was lowest at 7%.
For the state-owned-enterprise question, Central recorded the highest Yes response at 39%, while Southern recorded the lowest at 6%.
Notes on the Data
The figures presented above reproduce the information available in the supplied source material. Bases vary slightly between questions (851, 853 and 848), so the question-specific base should be used when interpreting each result.
Percentages may not always sum to exactly 100% because of rounding or presentation conventions. No additional weighting, statistical testing, margin-of-error calculation, or inference has been added because those details are not provided in the source material.
To provide the best experiences, we use technologies like cookies to store and/or access device information. Consenting to these technologies will allow us to process data such as browsing behavior or unique IDs on this site. Not consenting or withdrawing consent, may adversely affect certain features and functions.
Functional
Always active
The technical storage or access is strictly necessary for the legitimate purpose of enabling the use of a specific service explicitly requested by the subscriber or user, or for the sole purpose of carrying out the transmission of a communication over an electronic communications network.
Preferences
The technical storage or access is necessary for the legitimate purpose of storing preferences that are not requested by the subscriber or user.
Statistics
The technical storage or access that is used exclusively for statistical purposes.The technical storage or access that is used exclusively for anonymous statistical purposes. Without a subpoena, voluntary compliance on the part of your Internet Service Provider, or additional records from a third party, information stored or retrieved for this purpose alone cannot usually be used to identify you.
Marketing
The technical storage or access is required to create user profiles to send advertising, or to track the user on a website or across several websites for similar marketing purposes.
 Research Publication