 Research Publication
THE AUTHORS
Breakthrough Ravi Ratnasabpathy
The industry Surveys on Price Controls were commissioned by the Advocata Institute and are published as Discussion Papers. Discussion Papers are published to stimulate a discussion on the subject of price controls in Sri Lanka. Viroshan Tissera and Trisha Peries contributed to the reports. The field work for this report was completed in November 2017 and compiled by 31st March 2018. The reports as at 31st March 2018, except for Section 2 “Price controls on basic foodstuffs” where data was updated as at 30th June 2018.
FOREWORD
The control of prices as a means to control the cost of living.
The ‘cost of living’ is a topic that is never far from the minds of voters. When inflation rises, the clamour to do something mounts, in both political circles and the media. Freezing prices seems to be an obvious answer; something that goes back to 1970 in Sri Lanka.
Several years of monetary expansion had by 1970, created a cumulatively increasing inflationary pressure and an escalation in prices. The country was basically living beyond its means and corrective measures were urgently needed. Accordingly, a system of higher taxation (capital levy, wealth tax, etc.), income ceilings and forced and voluntary savings were introduced, accompanied by price control and rationing of essential commodities. The intervention increased as the performance of the economy deteriorated, so much so that Ronald Herring, in an article in the Economic and Political Weekly in 1987, identified the Sri Lankan economy at that time as the most controlled and restricted economy outside the Soviet bloc.
While prices and controls were partially freed in the post-1977 era they never completely disappeared. With increasing mismanagement of the economy, the fundamental problems that confronted the government in 1970; external and internal deficits and rising prices have returned to haunt Governments of today. It is not entirely surprising therefore to see the Government reverting to price controls once again.
The price controls of the 1970’s were rigidly enforced; imports were strictly controlled through licensing procedures, state monopolies and rationing of hard currency. Essential commodities were rationed and offered at subsidised prices. The widely-recognised result was scarcities, corruption, and blackmarketeering, as well as shortages.
The price controls of today do not seem to cause these problems, has the Government succeeded in finding the means by which prices may be controlled with no ill-effects?
This limited study attempts to unravel some of the questions around price controls in Sri Lanka, the economic and theoretical aspects on price controls, trader perceptions and the reality of some markets where price controls are applicable.
Unfortunately it fails to uncover some serendipitous exception to the known laws of economics that suggest that controlling prices may be done to no ill effect.
DHANANATH FERNANDO
Chief Operating Officer Advocata Institute
Acknowledgements
This project would not have been possible without the gracious support of many people who contributed their time, offered advice and helped in innumerable ways. In particular we wish to thank the Atlas Network for their support in making this report and project a success.
Key Points and Recommendations
Key Points
- The Government imposes price controls on a variety of items but our survey shows they are of limited value in controlling the cost of goods, particularly in the consumer market.
- A comparison of controlled prices over a ten month period with the prices in the retail markets as per the open market weekly average retail prices showed that of 13 basic groceries only one (milk powder) was being consistently sold at the controlled price throughout the entire period. No one, not even the Consumer Affairs Authority possesses a comprehensive list of items subject to price control. Loose enforcement prevents the most obvious symptoms of price controls from manifesting but at the expense of consumer choice and quality.
- Serious enforcement seems confined to items produced by multinationals or large corporates (milk powder, cement, cooking gas) which are administratively easier to police and who may be expected to comply. There only appears to be token enforcement in the unorganised sector.
- Where price controls are enforced (eg: cement, milk powder) it is done so in consultation with the industry, leading to a stickiness in prices. Retail prices are slow to rise when world market prices rise but are equally slow to fall when world market prices decline. It is doubtful if this exercise leads to any sustainable improvement in consumer welfare.
- The Government’s policies are often mutually contradictory; taxes and price controls are imposed on the same items. Taxes raise retail prices conflicting with the controls that are supposed to limit price increases.
- In responding to price controls, 40% of importers said that they would source lower quality products in order to remain within the vicinity of the controlled price.
- The survey indicates that price controls are of limited value in reducing costs. They can cause significant welfare losses, a deterioration in product quality, a reduction in investment and, in the long run, higher prices.
- Price Controls introduce a level of uncertainty to traders, especially when changes are made ad-hoc. This deters the development of a more formalised trade and tends to criminalise otherwise legitimate economic activity..
- Ultimately, fostering competition and improving productivity are the best form of price control as evidenced in the telecoms sector of Sri Lanka.
KEY RECOMMENDATIONS
- Little serious attempt appears to be Instead of attempting to protect agriculture through taxes (which raises prices for made to impose the price controls on consumers) the government should facilitate basic foodstuffs, particularly in the public markets. The controls encourage the modernisation of the sector, supporting sub-optimal behaviour including the investments that improve productivity. sourcing of poor quality or substandard items. Abolishing the controls will have minimal impact on prices while improving choice and quality.
- Taxes, specifically the Special Commodity Levy and CESS play a significant role in raising consumer prices. These are subject to ad-hoc revisions which prevent suppliers from entering longer term supply arrangements that could lead to lower long term prices. Creating the fiscal space for simplification of the system, moving to uniform rates and the lowering of taxes should be a priority.
- In specific sectors, Sri Lanka should either loosen or completely abolish price controls. For example:
- Tea and Hopper shops were subject to an arbitrary price control in 2015, that’s rarely enforced. At best, the control is useless and at worst it works against these small entrepreneurs legitimate business activity and open up for corruption. This control should be abolished.
- In the cement industry, the competent authority should at first move toward more dynamic pricing where firms in the industry are allowed more flexibility to cope with high demand or spikes in costs.
- In the dairy industry, policymakers should recognize the stated goal of self-sufficiency in milk production is not realistic. Abolishing of the MRP and lowering taxes would allow for healthy import competition for domestic producers, and would ultimately benefit consumers who are likely to get lower prices.
Instead of attempting to protect agriculture through taxes (which raises prices for consumers) the government should facilitate the modernisation of the sector, supporting investments that improve productivity.
PART I
INTRODUCTION
In Sri Lanka price controls are often associated with the pre-1977 era, but this is still in existence and its use only expanding. Most recently, price controls were imposed on sixteen essential items, including dhal, sugar, potatoes, and imported onions. The full gamut of controlled items ranges far wider than just food and includes fuel, electricity, telecommunications, transportation amongst others. Why does the government do this? In short: for political expediency – to be seen to be doing something about the rising cost of living. Does this work? No.
If we look at Sri Lanka today, for the most part, price controls do not benefit consumers. In fact, government policy does exactly the opposite – it maintains high prices for consumers. For food products in particular, the government intervenes actively with a variety of trade and price policies. These policies often have multiple, sometimes conflicting goals, such as containing retail prices, protecting farmers, and encouraging local producers.
The extreme distortions associated with price controls (shortages, queues, rationing, etc.) are not immediately visible in Sri Lanka, so it may be believed that the typical problems associated with controls are absent. This is in fact not the case, because closer analysis reveals a number of problems, the effects of which however are masked by the clever methods of implementation. Nevertheless, the impact of price controls is certainly not trivial, even if unseen. The Advocata Institute has recently conducted a survey on price controls, identifying a number of reasons for the absence of obvious distortions; including loose enforcement, loop-holes for producers and industry influences in setting controls on prices.
This survey of the retail and wholesale trade (Part II) indicates that for dry rations such as onions, potatoes, pulses, and rice, traders react to price control in two ways:
- The controlled price serves as a guide, but is not strictly followed.
- Low quality items are sourced, particularly bulk lots, close to expiry.1
Traders do try to import goods that they can then sell at the controlled price. This is sometimes a possibility. When it is not, the controlled price is either ignored or adjusted temporarily.2 What traders do is source the cheapest possible items and sell at above the controlled price. The Consumer Affairs Authority conducts periodic “raids” and if the trader is found out, they pay a fine.3
As the fine is a nominal one it does not serve as an effective deterrent, nor does it create an incentive for corruption; but the final result is that the controlled price is not followed. This explains the absence of shortages and queues. Is the solution the strict enforcement of controlled prices? This would almost certainly cause shortages, because traders would then curtail imports if it was uneconomical to import. The trader does however attempt to minimise the difference between the selling price and the controlled price, but the controlled price is not observed and quality suffers as a result.
As price is the main concern when sourcing, the quality of the goods is often lower than it could be. In attempting to comply with controlled prices, traders sometimes source large volumes of produce that are close to the end of shelf-life. 4 These are cheap enough to be sold at the controlled price. Such items are quickly disposed, occasionally below the controlled price and before the items become unsaleable.
The invisible problem is quality. Recent news reports inform us of raids that have detected rotten vegetables and potatoes in Karagampitiya (April 2018)5 and substandard cooking oil in Dambulla (December 2017)6.
The annual reports of the CAA for 2014 (the latest available on its website) notes that 72 consignements of goods were re-exported due to non-compliance with standards. In the previous year (2013) a total of 207 consignments were rexported. Why do traders import low quality goods? The theory predicts that if prices are set below the equilibrium, quality is likely to suffer, as noted in section 5. The limited survey of traders carried out in this study confirms this so perhaps the best way to minimise quality problems is to remove the incentive to bring low quality goods, which results from the imposition of price controls.
The photographs at the start of this section stocks of substandard onions and potatoes that were being returned by supermarkets to traders. Unscrupulous traders reportedly dispose of these in the informal markets or to food processors. Older news reports (20137, 20148) confirm this. Rotten vegetables have been detected being used in the National Hospital and also in warehouses – to be sold to eateries and bakeries.
All the traders surveyed admitted to the problem of low-quality goods being brought into the market, but always blamed “other” traders as the ones bringing in inferior goods9. If the price controls were rigidly enforced on these items, then shortages would occur, but either by design or by accident, enforcement is lax. Quality suffers as a result, and as almost all traders face similar pressures and import the cheapest available products, consumers are left with limited choice.
While citizens are made to believe that price controls are imposed to protect consumers, other government policies such as taxation and restrictions on imports, actually serve to increase, rather than cap retail prices. Many basics subject to price controls are also taxed, including potatoes, Bombay onions, ( taxed at Rs.40/kg) chillies (taxed at Rs.25/kg), and dried fish (taxed at Rs.102/kg*). The taxes add anything from 5% to 30% to retail prices.
The government attempts to minimise price movement in by changing the controlled price level or taxes, to compensate for movement in world market prices. Sometimes taxes are lowered when world market prices rise, and sometimes they are raised -as in the recent case of sugar-, when world market prices drop.
For example, taxes on sugar were increased by Rs.8/kg following a Rs.10/kg decline in world market prices; but the controlled price remains unchanged at Rs.95/kg. Thus, consumers have to pay a higher price than necessary, thanks to the price control. A decline in world market prices has not been passed, instead has been split between
the government and traders. In this example the government intervenes first to tax, raise costs, and then to set a maximum selling price. The tax is substantial at about 30% of selling price (and over 50% of landed cost) which raises prices; it then imposes a maximum selling price. The two policies are mutually contradictory and resulted in consumers paying higher prices than if a free a market prevailed. This is true of several other commodities.
As price controls and taxes on food imports change in an ad-hoc manner, traders take a very transactional approach to imports, bringing down whatever can be quickly disposed at the lowest cost. There is little incentive to develop supplier relationships based on quality, reliability, or regular supply, which could possibly lead to better prices in the long term. Moreover, the unpredictable policy environment caused by ad-hoc revisions to taxes and controlled prices inhibits the use of futures/forward contracts by traders that could hedge against unexpected spikes in commodity prices.
In other industries such as dairy or chicken**, price controls are imposed on selected items only, enabling producers to sell other items at higher prices and recover any losses. For example, until recently price controls were imposed on whole chicken but not on chicken parts. Producers naturally prefer to sell chicken parts but the government pressures the industry to supply a minimum quantity of whole chicken. It follows that there are frequent shortages of whole chicken but as chicken parts are freely available (albeit at higher prices), consumers may not notice the shortage.
Similarly, in the dairy industry a price control exists on powdered milk, but not on other products which are sold at much higher prices. In this instance, importers of powdered milk are large companies and the controlled price is easier to police. Shortages do not occur as the companies supply even at a loss, but the controlled price is not reduced significantly when world market prices drop, in order to allow the companies to recoup losses incurred at times when prices are high. There is greater stability in prices, but the controls reduce the level of risk and serve as a deterrent to price competition. Players seek to maximise returns when raw material prices are low to the detriment of consumers to compensate for anticipated losses when costs rise. Uncertainty in prices may also be a deterrent to new entrants, reducing the level of competition.
It appears that price controls in Sri Lanka are largely political theatre – done for public
consumption. Politicians strive to gain approval from the public by being seen to do something about the cost of living. Tax policy is frequently at variance with the objectives of the price control regime – taxes are imposed raising costs, even while selling prices are controlled. For example, almost all the commodities recently subject to price controls including dhal, sugar, potatoes, and onions are also subjected to import taxes, some of which add significantly to costs.
The Consumer Affairs Authority, which is meant to regulate prices, does not even publish a comprehensive list of the controlled prices 10. The website lists only six items (LP Gas, cement, milk powder, chicken, rice, and pharmaceuticals) and some data had not been updated since 2014/15. Customer complaints are fundamental to effective enforcement– if consumers have no knowledge of the controlled price, then the system is bound to be ineffective.
Given the widening use of price control, the critical question is: are price controls an effective tool to achieve the stated objective of controlling the cost of living? Does it improve overall welfare?
Far from improving welfare, it appears that the tangle of price controls and taxes actually raises retail prices. The price control regime appears to be little more than a charade. The way to reduce the cost of living is not through price controls, but by reducing taxes and dismantling the controls.
* Some of these taxes have recently been reduced after the completion of the report.
** Price controls on chicken have recently been lifted.
The legal basis for the regulation of prices and trade in Sri Lanka.
The regulation of prices is carried out by the Consumer Affairs Authority (CAA) of Sri Lanka. The CAA was set up by the Consumer Affairs Authority Act No.9 of 2003. The previous laws which dealt with issues of trade and prices, viz the Consumer Protection Act No.1 of 1979, the Fair Trading Commission Act No.1 of 1987 and the Control of Prices Act of 1950 were repealed and the Fair Trading Commission and the Department of Internal Trade were abolished and replaced with the establishment of the Authority. The Consumer Affairs Authority consists of a Chairman and a minimum number of 10 other Members representing different fields of expertise, such as industry, law, economics, commerce, administration, accountancy, science and health, in order to assist the policy making in meeting the goals and objectives of the Authority under the Act. Provision is made available in the Act for the appointment of 3 of the Members, in addition to the Chairman, on a full-time basis. The Director General, who is also the Chief Executive Officer, is responsible for carrying out the functions of the Authority who is also required to function as the Secretary to the Authority.
The CAA is authorized to regulate trade in a number of ways
- Regulate prices. Any item of goods or services, which is considered as essential to the life of the community, may be “specified” as an essential commodity by way of gazette notification by the Minister responsible for the Consumer Affairs Authority. Manufactures or traders cannot increase the price of the product without the prior written approval of the Authority. A period of 30 days is provided for the authority to examine the application for any price revision and convey the decision to the applicant company.
- CAA can intervene in the market in order to curb malpractices and safeguard consumers.
- Determine general and special directions relating to manufacture, import, selling, storing, distribution of goods and services.
- Taking action to assure the quality of the goods and services.
- Investigate or inquire in to products and services which do not confirm with standards or warranties.
- It may enter in to agreements with manufacturers or traders on maximum price, standards, and specifications or other conditions of manufacture, import, supply, storage, distribution, transportation, marking, labeling or sale of any goods.
- Investigate or inquire into anti-competitive practices and abuse of dominant position.
- The authority may on a compliant or request made to it by any person, any organization, of consumers or associations of traders, carry out an investigation with respect to the prevalence of any anti-competitive practices.
-1- PRICE CONTROLS ON BASIC FOODSTUFFS
A Game of Charades : The lackadaisical implementation of price controls on basic foods
By Ravi Ratnasabapathy
The Government has imposed price controls on a number of basic foods in order to control the cost of living. For the purpose of study, we wanted to ascertain the products subject to controls, as well as the prices at which they were supposed to be sold. A list of price controlled items is a straightforward piece of information that should be readily available to any consumer. Unfortunately, this does not appear to be available anywhere. The website of the Consumer Affairs Authority (CAA) lists a few items; gas, cement, milk powder, chicken, rice, and pharmaceuticals. The other items were not listed.
The information on the CAA website is out dated (eg. A controlled price from 2014 is listed for chicken although chicken was removed from the list of controlled items in April 2017). On inquiring from the CAA over telephone, we were asked to refer to the website. A list was eventually compiled after a field visit to the CAA by extracting the relevant information from copies of the gazettes. How are price controls to be enforced if a list of items subject to control is not readily available? The proper approach would be to ensure that list of controlled prices is displayed at every outlet, so customers know if they are being overcharged and can then make their purchasing decisions accordingly.
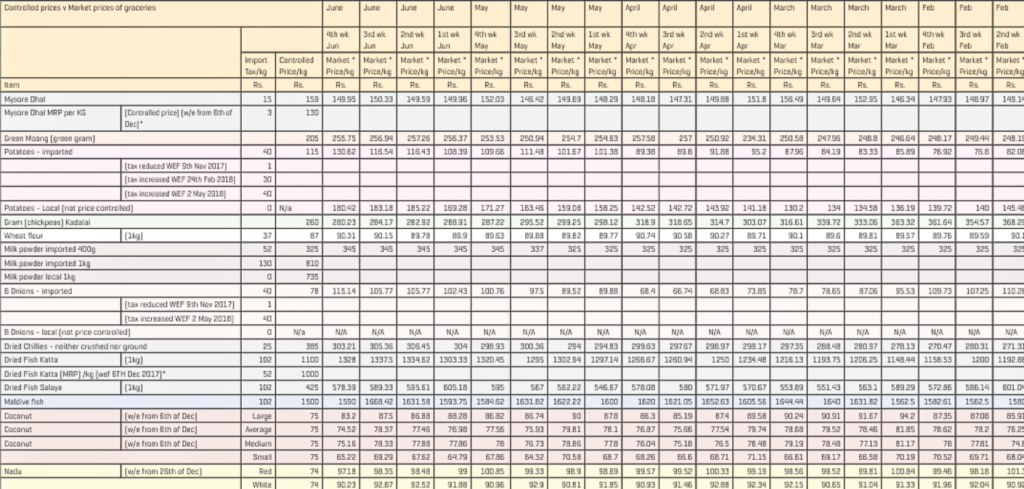
Having compiled a list, we compared the controlled prices with the weekly market prices published by the Department of Census and Statistics in its survey of the main markets in the Colombo district in the period 1st September 2017 to 30th June 2018 (Refer Table 1).
Table 1: Controlled prices v Market prices of groceries
*Taxes reduced with effect from 9th Nov 2017
OPEN MARKET WEEKLY AVERAGE RETAIL PRICES – 1st week of September 2017 to 4th week of June 2018
Main markets in Colombo district, Dept of Census and Statistics
Import ControlledMarket *Market *Market *Market *Market * Tax/kgPrice/kg Item Mysore Dhal Mysore Dhal MRP per KG
(Controlled price) (w/e from 6th of Dec)* Green Moong (green gram) Potatoes – imported (tax reduced WEF 9th Nov 2017) (tax increased WEF 24th Feb 2018) (tax increased WEF 2 May 2018) Potatoes – Local (not price controlled) Gram (chickpeas) Kadalai Wheat flour
(1kg) Milk powder imported 400g Milk powder imported 1kg Milk powder local 1kg B Onions – imported (tax reduced WEF 9th Nov 2017) (tax increased WEF 2 May 2018) B Onions – local (not price controlled) Dried Chillies – neither crushed nor ground Dried Fish Katta
(1kg) Dried Fish Katta (MRP) /kg (wef 6TH Dec 2017)* Dried Fish Salaya
(1kg) Maldive fish Coconut
(w/e from 6th of Dec) Coconut
(w/e from 6th of Dec)
Average Coconut
(w/e from 6th of Dec)
Medium
Nadu
(w/e from 26th of Dec)
* Taxes reduced with effect from 9th Nov 2017 OPEN MARKET WEEKLY AVERAGE RETAIL PRICES – 1st week of September 2017 to 4th week of June 2018 Main markets in Colombo district, Dept of Census and Statistics
June
June
June
June
May
4th wk 3rd wk 2nd wk 1st wk 4th wk Jun
Jun
Jun
Jun
May
Price/kgPrice/kgPrice/kgPrice/kgPrice/kg Rs.
Rs.
Rs.
Rs.
Rs.
Rs.
Rs. 159149.95150.33149.59149.96152.03
205255.75256.94257.26256.37253.53 115130.62116.54116.43108.39109.66
0N/a
180.42183.18185.22169.28171.27 260280.23284.17282.92288.91287.22 8790.3190.1589.78
89.989.63
78115.14105.77105.77102.43100.76
N/a
N/A
N/A
N/A
N/A
N/A 385303.21305.36306.45
304298.93 13281337.51334.621303.331320.45
425578.39589.33595.61605.18 15901668.421631.581593.751584.62 Large
83.2
87.586.8888.2886.82 7574.5278.37
77.4676.98
77.56 7575.1678.33
77.88
77.86 Small
7565.2269.29
67.6264.79
67.86 Red
97.1898.3598.48
99100.85 White
7490.2392.8792.5291.8890.96
May
May
May
April
April
April
April
3rd wk 2nd wk 1st wk 4th wk 3rd wk 2nd wk 1st wk 4th wk 3rd wk 2nd wk 1st wk 4th wk 3rd wk 2nd wk May
May
May
Apr
Apr
Apr
Apr Market *Market *Market *Market *Market *Market *Market *Market *Market *Market *Market *Market *Market *Market * Price/kgPrice/kgPrice/kgPrice/kgPrice/kgPrice/kgPrice/kgPrice/kgPrice/kgPrice/kgPrice/kgPrice/kgPrice/kgPrice/kg Rs.
Rs.
Rs.
Rs.
Rs.
Rs.
Rs. 146.42149.69148.29148.18147.31149.88151.8156.49149.64152.95146.34147.93148.97149.14
250.94254.7254.63257.58
257250.92234.31250.58247.96248.8246.64248.17249.44248.19 111.48101.67101.3889.38
89.891.88
95.2
163.46159.08158.25142.52142.72143.92141.18130.2 295.52299.25298.12318.9318.65314.7303.07316.61339.72333.06363.32361.64354.57368.29 89.8889.8289.7790.7490.5890.2789.71
97.589.5289.88
68.466.7468.8373.85
N/A
N/A
N/A
N/A
N/A
N/A
N/A 300.36
294294.83299.63297.67298.97299.17297.35288.48280.97278.13270.47280.31271.31 12951302.941297.141266.671260.94
12501234.481216.131193.751206.251148.441158.53
567562.22546.67578.08
580571.97570.67553.89551.43563.1589.29572.86586.14601.04 1631.821622.22
16201621.051652.631605.561644.44 86.74
87.8
86.385.19
87.489.5890.2490.9191.67 75.9379.81
78.176.8775.66
77.5479.7478.6879.5278.4681.8578.62 76.7378.86
77.876.0475.18
76.578.4879.1978.48 64.3270.58
68.768.26
66.668.7171.1566.6169.1766.5870.1970.5269.7168.04 99.33
98.998.6999.5799.52100.3399.1998.5699.5299.81100.8499.4698.18101.3
MarchMarchMarchMarchFeb
Feb
Feb
Mar
Mar
Mar
Mar
Feb
Feb
Feb
Rs.
Rs.
Rs.
Rs.
Rs.
Rs.
Rs.
87.9684.1983.3385.8976.92
76.882.08
134134.58136.19139.72
140145.48
90.1
89.689.8189.5789.7689.59
90.1
78.778.65
87.0695.53109.73107.25110.26
N/A
N/A
N/A
N/A
N/A
N/A
N/A
12001192.86
16401631.821562.51582.611562.5 94.2
87.35
87.0885.91 78.276.25 77.1381.17
77.81
74.8
92.990.8191.8590.9391.4692.8892.3492.1590.6591.0491.3391.9692.0490.92
Table 1 (Cont) Controlled prices v Market prices of groceries Table 1
Controlled prices v Market prices of groceries
Feb
1st wk 4th wk 3rd wk 2nd wk 1st wk 4th wk 3rd wk Feb Market *Market *Market *Market *Market *Market *Market * Price/kgPrice/kgPrice/kgPrice/kgPrice/kgPrice/kgPrice/kg Item Mysore Dhal Mysore Dhal MRP per KG
(Controlled price) (w/e from 6th of Dec)* Green Moong (green gram) Potatoes – imported (tax reduced WEF 9th Nov 2017) (tax increased WEF 24th Feb 2018) (tax increased WEF 2 May 2018) Potatoes – Local (not price controlled) Gram (chickpeas) Kadalai Wheat flour
(1kg) Milk powder imported 400g Milk powder imported 1kg Milk powder local 1kg B Onions – imported (tax reduced WEF 9th Nov 2017) (tax increased WEF 2 May 2018) B Onions – local (not price controlled) Dried Chillies – neither crushed nor ground Dried Fish Katta
(1kg)
1211.29 Dried Fish Katta (MRP) /kg (wef 6TH Dec 2017)* Dried Fish Salaya
(1kg) Maldive fish
1609.09 Coconut
(w/e from 6th of Dec) Coconut
(w/e from 6th of Dec) Coconut
(w/e from 6th of Dec)
Nadu
(w/e from 26th of Dec)
* Taxes reduced with effect from 9th Nov 2017 OPEN MARKET WEEKLY AVERAGE RETAIL PRICES – 1st week of September 2017 to 4th week of June 2018 Main markets in Colombo district, Dept of Census and Statistics
Decem-Decem-
Jan
Jan
Jan
Jan ber
ber
Jan
Jan
Jan
Jan
Dec
Dec
Rs.
Rs.
Rs.
Rs.
Rs.
Rs.
Rs. 147.22151.2149.59154.33156.78157.18157.47
247.59253.08252.58253.03255.12256.69251.06 84.2279.6382.3192.78100.56
95.33100.17
162.19
150151.15158.65162.73158.52161.92 365.03374.88374.07372.09376.09377.93374.42 91.4689.8190.0489.62
89.88
9089.58
124.18149.87149.13144.95
140151.88156.08
N/A
N/A
N/A
N/A
N/A
N/A 268.67264.57264.57266.76267.58272.65267.43 11541197.731195.831174.071233.93
576.19581.7574.89569.62563.03571.33554.7 16201631.821654.551652.171621.741591.67 89.25
8584.3282.75
89.23
86.7 78.3175.3874.8275.29
78.81
76.3682.73 76.875.3774.7875.36
77.41
75.8280.59 68.8965.7765.37
67.78
69.78
66.5572.61 105.04101.95102.33104.21
105105.32105.15 92.05101.799.73100.47102.52101.42102.71
Decem-December
ber 2nd wk 1st wk 4th Wk 3rd Wk 2nd Wk 1st Wk 4th Wk 3rd Wk 2nd Wk 1st Wk 4th Wk 3rd Wk 2nd Wk 1st Wk Dec
Dec
Nov
Nov
Nov
Nov
Oct
Oct
Oct
Oct
Sep
Sep
Sep
Sep Market *Market *Market *Market *Market *Market *Market *Market *Market *Market *Market *Market *Market *Market * Price/kgPrice/kgPrice/kgPrice/kgPrice/kgPrice/kgPrice/kgPrice/kgPrice/kgPrice/kgPrice/kgPrice/kgPrice/kgPrice/kg Rs.
Rs.
Rs.
Rs.
Rs.
Rs.
Rs.
Rs.
Rs.
Rs.
Rs.
Rs.
Rs.
Rs. 159.59159.78161.44165.22174.43177.88181.26180.23179.44175.66179.94180.28179.46177.82
254247.93248.14252.36261.77259.96257.62
257.1253.3253.71255.81253.89253.59256.76 99.8291.2584.17
88.3109.08117.92120.96122.62120.21119.14118.93119.23123.33118.8
154.5153.04144.94150.07152.05165.63159.5164.38162.67160.15164.91163.81
175173.45 370.33360.71356.84
352354.08351.18351.33351.18346.5345.64349.58347.19343.58333.73 89.5588.8889.1589.9690.2490.4790.41
9090.0689.4589.9188.7188.6488.92
151.58146.62154.64142.43136.94192.33151.89146.05144.29131.05137.35131.89153.46150.76
183.33
161.75225.26182.17119.09121.4113.86114.38
n/a
n/a
n/a 263.24
255255.69255.75249.66247.41246.25249.82247.22243.33245.17240.69242.86240.36 1217.741241.671262.91241.67
12501274.071264.521269.231266.071222.061253.031248.481266.671248.21
591.33589.91591.9605.11634.21629.96623.88629.17611.67604.41608.33590.56595.83588.81 16331706.251686.671657.141629.411608.331623.81
16001614.291612.5 96.4799.17 85.8988.71 85.7789.84 75.43
77.12 106.03104.73 101.62100.75
It is evident from the table we have collated that Chart 01 Nadu White – Impact of imposing a new controlled price the controlled prices are not being followed in (Rs.74/kg imposed on 26th Dec 2017 most instances. Nadu – Retail price vs controlled price The surveys of traders by Breakthrough indicate that 67% of retailers and 46% of wholesalers react to raids by the CAA by temporarily adjusting prices. Price in Rupees75
They later revert to business as usual. Trying to enforce retail level price control across the informal trade and public markets is a practical impossibility. The CAA annual report (2014) states 1st week Dec3rd week Dec4th week Dec1st week Jan3rd week Jan4th week Jan1st week Feb3rd week Feb4th week Feb1st week Mar3rd week Mar4th week Mar1st week Apr2nd week Apr3rd week Apr4th week Apr1st week May
2nd week May3rd week May4th week May
2nd week Mar
1st week June2nd week June3rd week June4th week June
Time period
2nd week Feb
2nd week Dec
2nd week Jan
that 22,402 raids were carried out that year and 25,287 in 2013. This is small fraction of 205,573 Time period (20172018) retail outlets (general as well as those specialised Retail Price Controlled Price in food, beverages & tobacco) in the country. Chart 02 In any case if the controlled prices were strictly Coconut – Impact of imposing a new controlled price enforced, then the usual distortions such as ( Rs.75/nut imposed on 6th Dec 2017 shortages and queues would become obvious with
Coconut – Controlled price vs retail price unpalatable political consequences. The CAA is successful in enforcing prices on items Price in Rupees70
supplied by large businesses or corporates such as in cement or milk powder. Whether this actually keeps prices low is questionable. 1st week Dec3rd week Dec4th week Dec1st week Jan3rd week Jan4th week Jan1st week Feb3rd week Feb4th week Feb1st week Mar3rd week Mar4th week Mar1st week Apr2nd week Apr3rd week Apr4th week Apr1st week May
2nd week May3rd week May4th week May
2nd week Mar
1st week June2nd week June3rd week June4th week June
Time period
2nd week Feb
2nd week Dec
2nd week Jan
Large businesses are relatively easy to monitor and they are open to pressure to supply even at Time period (20172018) a loss; on the implicit understanding that they Retail Price Controlled Price will be allowed to recoup this at some point, as noted in the articles included in the appendices Chart 03 to this report. This is very clear in the table below, Mysore dhal impact of change in control price ( Rs.159/-, where the only item consistently being sold at
revised to Rs.130/ on 6th December) the controlled price is milk powder produced by a Mysore DhalControlled Price vs Retail Price multinational. Wheat flour, which is also produced by large corporates tends to track the controlled price closely. The majority of the other items were Price in Rupees
being traded at prices above the controlled price. During the period under survey, price controls were imposed on Nadu rice ( 26th December 2017) coconuts (6th December) and revised on dhal 1st week Sep3rd week Sep1st week Oct3rd week Oct1st week Nov3rd week Nov1st week Dec3rd week Dec1st week Jan3rd week Jan1st week Feb3rd week Feb1st week Mar1st week Apr3rd week Apr
1st week May3rd week May
1st week June3rd week June
3 rd week Mar
and kata (6th December) with minimal impact on prices as illustrated in charts 1-4. Time period (20172018) Mysore Dhal Retail Price Mysore Dhal Controlled Price
See Graph 16 in the “Public Perception” section See Graph 14 in the “Public Perception” section Economic Census 2013/14 – Informal Non-Agricultural Activities, Dept of Census & Statistics, November 2017
Chart 04 Katta impact of change in controlled controlled ( Rs.1100/-, revised to Rs.1000/ on 6th December) KattaRetail price vs controlled price
Price in Rupees
1st week Sep3rd week Sep1st week Oct3rd week Oct1st week Nov3rd week Nov1st week Dec3rd week Dec1st week Jan3rd week Jan1st week Feb3rd week Feb1st week Mar1st week Apr3rd week Apr
1st week June3rd week June
1st week May3rd week May
3 rd week Mar Time period (20172018) Dried Fish-Katta Retail Price Dried Fish-Katta Controlled Price
The impact of taxes on prices is particularly interesting. (refer charts 5-7). When some taxes were reduced in November 2017 (dhal, potatoes, Big onions), prices declined on these items over period of weeks, sometimes falling below the controlled price. When taxes were later raised (potatoes to Rs.30/kg on 24th February, B onions to Rs.40 on 2nd May) prices rose again eventually breaching the controlled price. In the case of dhal prices eventually fell below the original controlled price (159/kg) following the reduction in tax – but prices did not respond significantly when the controlled prices was reduced to Rs.130 (6th Dec
Chart 05 Big onions : Impact of taxes on prices. Reduced in November, raised in May B-Onions (Price fluctuations)
Retail Price in Rupees
1st week June3rd week June
1st week Sep3rd week Sep1st week Oct3rd week Oct1st week Nov3rd week Nov1st week Dec3rd week Dec1st week Jan3rd week Jan1st week Feb3rd week Feb1st week Mar1st week Apr3rd week Apr1st week May
3rd week May
3 rd week Mar Time period (2017 – 2018) B Onions Retail Price B Onions Controlled price B Onions Tax/kg
Chart 06 Potatoes : Impact of taxes on prices. Reduced in November, raised in February and again in May Potatoes (Price fluctuations)
Retail price
Tax per Kg
1st week June3rd week June
1st week Sep3rd week Sep1st week Oct3rd week Oct1st week Nov3rd week Nov1st week Dec3rd week Dec1st week Jan3rd week Jan1st week Feb3rd week Feb1st week Mar1st week Apr3rd week Apr1st week May
3rd week May
3 rd week Mar Time period (20172018) Potatoes Retail Price Potatoes Controlled price Potatoes Tax/kg
Chart 07 Dhal : Impact of taxes on prices. Reduced in November Mysore DhalControlled Price vs Retail Price
Price in Rupees
1st week June3rd week June
1st week May3rd week May
1st week Sep3rd week Sep1st week Oct3rd week Oct1st week Nov3rd week Nov1st week Dec3rd week Dec1st week Jan3rd week Jan1st week Feb3rd week Feb1st week Mar1st week Apr3rd week Apr
3 rd week Mar Time period (2017 – 2018) Mysore Dhal Retail PriceMysore Dhal Controlled Price Tax
This underlines the case for reducing specific food taxes if there is any serious intention to control prices. It is also worth noting the difference in prices between imported and local items, potatoes, and big onions. Locally produced items are not subject to tax or price control, but when available, these retail at prices higher than the controlled price and are sometimes higher than the (taxed)
Tax per Kg
imported items. Instead of attempting to protect agriculture through taxes (which raises prices for consumers) the government should facilitate the modernisation of the sector, supporting investments that improve productivity (eg mechanisation, drip irrigation, greenhouses, quality seeds etc). Addressing the inefficiencies within local agriculture is the sustainable way to lower prices: increased productivity raises farmer incomes and lower consumer prices in the long term. Using controls to reduce prices does not appear to work. The scheme itself is ill-conceived and there seems little intent or capacity to enforce. Reducing taxes, increasing competition and productivity in local agriculture is a surer path to lower consumer prices.
The crucial role of
prices in solving
the economic
problem
2 The crucial role of prices in solving
the economic problem
First published by the Institute of Economic Affairs. Excerpt from “Flaws and Ceilings: Price Controls and the damage they cause.”
Prices are a commonly misunderstood concept. Many view prices as random numbers assigned by a seller. Related to this, many see prices as being an impediment to accomplishing their desired goals. For example, a young adult may desire to live in central London but quickly realises that they cannot to do so given the relatively high price of renting a flat in that area. The view of prices as impediments to achieving one’s goals is one reason why there are so often calls for politicians and regulators to place controls on prices. The belief, from the perspective of proponents of price controls, is that, if regulators impose controls, then people will be able to achieve goals that would otherwise be unachievable. For example, in order to assist younger citizens with their cost of living, a politician may propose some combination of rent controls and a living wage to make cities such as London more affordable. These views, however, misconstrue the fundamental nature and role that prices play in an economic system. Prices are central to solving the core economic problem that all societies face: how are scarce resources to be (re)allocated to meet as many of the unlimited wants of consumers as possible? Answering this question is crucial for improving standards of living since the more consumer wants can be met, the better off people are. One of the main contributions of Nobel Laureate F. A. Hayek (1945) was his clarification of the exact nature of the economic problem. He noted: ‘The economic problem of society is … not merely a problem of how to allocate “given” resources – if “given” is taken to mean given to a single mind which deliberately solves the problem set by these “data”. It is rather a problem of … the utilization of knowledge which is not given to anyone in its totality’ (pages 519–20). Hayek’s point is that economic interactions rely on dispersed knowledge, some of which exists for all to grasp but much of which is inarticulate, tacit knowledge that is difficult to make explicit and is not available to everyone (see Hayek 1945; Lavoie 1986). Such knowledge must be discovered through experience
and experimentation (see Hayek 1978). Because tacit knowledge cannot be expressed in an objective manner, it is not ‘out there’ for others to obtain in the same way as articulated knowledge in books lining library shelves (see Lavoie 1985: 76–87; Boettke 2002). Part of the reason that markets are so effective in allocating resources is that they allow dispersed individuals to take advantage of the knowledge possessed by others to discover a solution to the economic problem. But how do markets do this? At the core of the effectiveness of markets is the notion of ‘economic calculation’, which refers to the decision-making process of how to best allocate scarce resources among the array of feasible alternatives. Economic calculation refers to the determination of the expected value-added of a potential course of action. For example, should scarce steel be used to construct a new office building, school building, hospital or some other structure? Or should it sit idle because none of the possible alternatives are profitable given the cost of steel and other inputs? By comparing the relative expected value-added across feasible alternatives, decision makers are able to choose the course of action with the highest expected social return. Crucial to this decision-making process are money prices and profit-and-loss accounting. Money prices, which serve as a common unit of calculation, capture the relative scarcity, or opportunity cost, of different goods based on context-specific conditions, and they communicate this information to others in the economy (see Mises 1920; Hayek 1945; Thomsen 1992). This is powerful precisely because people are able to act on the context-specific knowledge reflected in prices without needing to actually possess any specific insight into the actual local conditions. For example, if a loaf of organic bread from a local baker costs £1.50, this reflects the costs of production and distribution of the bread (including the value of the time of the assistant serving in the shop) as well as reflecting the demand for organic bread relative to alternatives by other consumers. It is not necessary for the buyer to know anything about the baker’s preferences for leisure versus working, how or why the ingredients cost the amount they do, or why resources to other uses. other consumers may be willing to pay more for This ongoing process has several effects. The organic bread than other types of bread. Nor is it profit will tend to draw other entrepreneurs into necessary for potential suppliers who are thinking the market who will seek to capture customers by of entering the market to know these things. charging a lower price. Another important effect This information is reflected in prices in a freely is that entrepreneurs face constant pressure functioning economy. to come up with new and cheaper means of The economist Thomas Sowell (1980) effectively producing the good so as to increase their profit. captures this point when he writes: ‘Prices are
If they cut production costs from £25 to £20, they important not because money is considered
keep these savings as additional profit – though paramount but because prices are a fast and
other producers will then be attracted into the effective conveyor of information through a vast
market so that prices may then fall. The result is society in which fragmented knowledge must
ever-present competition and innovation, which be coordinated’ (page 80). This information is
benefit consumers since producers must adjust to crucial because it allows people to compare
meet their demands in order to remain profitable. the prices of inputs, which reflect underlying It is the information and incentive provided by scarcity conditions, to the expected profitability monetary prices and profit-and-loss accounting of numerous alternatives, all of which are that makes markets so effective in solving the technologically feasible (see Hoff 1981; Boettke economic problem. The process of economic 1998; Horwitz 1996, 1998). The resulting calculation guides market participants in adapting profit or loss – the difference between the cost their plans and reallocating resources to new and of production and the sales price – provides more highly valued uses to maximise the wellfeedback as to whether this estimate was being of consumers. The lure of profit incentivises accurate or not. A profit indicates that resources innovation, and prices guide innovators in have been combined in a manner that generates determining which projects are feasible and value to others, while a loss signals the opposite: it which are not. Mistakes are, of course, frequently signals that resources could have been allocated made, but markets provide the information and to a higher-valued use that would increase welfare. incentives to adapt accordingly. A simple example will illustrate this logic. Economic calculation is especially crucial as Consider a scenario in which an entrepreneur the production of goods and services becomes produces a new product for a cost of £25 and increasingly complex, which is a defining sells it for a price £50. What does this £25 profit characteristic of economic progress and an indicate? There are many other things that the advanced economic system. The economist Don producer could have made using the resources Lavoie (1985) captures this point when he writes: that cost him £25. Some would have led to a loss ‘price information represents knowledge about while others would have led to a smaller profit. a continually and rapidly changing structure of The profit of £25 indicates that consumers value economic relationships’ (page 82). To understand the good produced more than the alternatives this point, consider the complexity involved in the that could have been produced with those same production of what is typically considered by those resources. This profit signals to the producer, as in developed countries to be a basic good – a well as to other entrepreneurs, that they have toaster. allocated resources in a manner that consumers value relative to the alternatives and encourages Thomas Thwaites (2014), a London-based them to supply more. A loss signals that designer, embarked on a fascinating project, the consumers do not value the current allocation ‘Toaster Project’, in which he attempted to build of resources. The loss provides an incentive for a simple toaster by hand and from scratch. He entrepreneurs to adjust by reallocating scarce quickly found that the project was an extremely complicated one. The toaster required copper, iron, nickel, mica and plastic, all of which Thwaites one is in charge that makes markets so flexible had to obtain from mines and other sources in a variety of geographical locations. After much travel unique skills and knowledge is able to engage and effort to extract and process the necessary materials, he constructed his (extremely ugly) toaster, which proceeded, upon being plugged into an electric socket, to burn out in a matter of seconds. His project is a perfect illustration of the importance of economic calculation as indicated by his realisation that ‘the scale of industry involved in making a toaster is ridiculous but at the same time the chain of discoveries and small technological developments that occurred along the way make it entirely reasonable’ (2014). This chain of events was guided by the feedback provided by economic calculation coupled with the adaptability of markets. The result is that toasters Boettke, P. J. (1998) Economic calculation: are readily available to consumers when they want the Austrian contribution to political economy. them at a relatively low price. Further adding to the sheer complexity of advanced economies is the importance of what economists call complementary goods: goods and Review of Austrian Economics 15(4): 263–74. services that are consumed together. For example, cars require petrol, spare parts, repair equipment and trained mechanics in order to operate. Just like the construction of a basic toaster, most people living in relatively wealthy societies take the wide array of complementary goods available for granted. However, when one considers the level of coordination required for each of these various complementary goods not only to be produced but to be available and waiting when needed by consumers, these taken-for-granted goods and services are truly amazing phenomena. Someone, somewhere, has to anticipate the need for these complementary goods and services and make them available to consumers on demand. In markets, consumers do not submit a master wish list to a central planner who then allocates resources accordingly. Instead, prices and profitand-loss accounting guide entrepreneurs in discovering a (new) solution to the economic problem by producing and innovating existing and new goods and services that consumers value. This process is the essence of broader economic progress as resources are reallocated, on an ongoing basis, to their highest-valued, welfare- maximizing use. It is precisely the fact that no and effective. Each individual who possesses in experimentation and discovery that benefits not only themselves but others as well. Market prices link individuals and markets together by communicating a vast amount of information. The lure of profit and fear of loss incentivise people to continually adjust their behaviour. Given this understanding of the market process and the central role played by prices, we are now in a position to understand the consequences of imposing price controls. References
Advances in Austrian Economics 5: 131–58. Boettke, P. J. (2002) Information and knowledge: Austrian economics in search of its uniqueness.
Hayek, F. A. (1945) The use of knowledge in society. American Economic Review 35(4): 519–30. Hayek, F. A. (1978) Competition as a discovery procedure. In New Studies in Philosophy, Politics, Economics, and the History of Ideas (ed. F. A. Hayek). Chicago, IL: University of Chicago Press. Hoff, T. J. B. (1981) Economic Calculation in the Socialist Society. Indianapolis, IN: Liberty Fund. Horwitz, S. (1996) Money, money prices, and the Socialist calculation debate. Advances in Austrian Economics 3: 59–77. Horwitz, S. (1998) Monetary calculation and Mises’s critique of planning. History of Political Economy 30(3): 427–50. Lavoie, D. (1985) National Economic Planning: What Is Left? Cambridge, MA: Ballinger Publishing Company. Lavoie, D. (1986) The market as a procedure for discovery and conveyance of inarticulate knowledge. Comparative Economic Studies 28(1): 1–19.
Mises, L. von. (1920 [1935]) Economic calculation in the Socialist commonwealth. In Collectivist Economic Planning (ed. F. A. Hayek). London: Routledge. Sowell, T. (1980) Knowledge and Decisions. New York: Basic Books. Thomsen, E. F. (1992) Prices and Knowledge: A Market-Process Perspective. New York: Routledge. Thwaites, T. (2014) The toaster project. http:// www.thetoasterproject.org/page2.html (accessed 10 March 2015).
Summary of
Industry Surveys
3 Summary of Industry Surveys
i Price Controls on Milk Powder The survey conducted highlights the following:
- The bulk of the consumption is in the form
of milk powder, which is price controlled. Liquid milk and other value added products (eg cheese, yoghurt etc) are not controlled.
- Maximum Retail Price (MRP) imposed
on milk powder, declared an essential commodity in Section 18 of the Consumer Affairs Authority Act No.9 of 2003.
- The price of raw milk, at the farm gate is
also controlled.
- In addition, the import of milk powder is
taxed. These policies are inherently contradictory. What is effectively a minimum farm gate price raises input costs for producers, which translates to higher prices for the consumer. Similarly, the tax imposed on imported milk powder also serves increase retail prices. The price control creates a ‘stickiness’ in prices which rise more slowly when global prices rise but also fall more slowly when world prices decline. The survey concludes that ,” it is evident that there is a disconnect with the aim of achieving self-sufficiency and the role of price controls, both at a retail level, with the use of MRPs, and at a farm gate level. The removal of the MRP would allow for a higher level of healthy competition among both importers and local dairy manufacturers, allowing market forces to decide prices”. The full survey is available in Part II of this report. An op-ed by Ravi Ratnsabapathy in the Appendix 01 to this report examines some of the absurdities with controls in the dairy sector.
ii Price Controls on Cement The survey highlights the following:
- Cement is an important component of
construction cost, forming about 22% of residential building cost.
- There are two major local manufacturers
and competition is constrained by a Government policy that restricts the number of plants (to one per port).
- The role of the industry in setting the
controlled prices. Local manufacturers make periodic applications for revisions in prices, depending on their input costs.
- The report concludes that some degree
of prices control, albeit a more flexible arrangement than the present, may be desirable due to the oligopolistic nature of the market. The full survey is available in Part II of this report. This survey was restricted only to cement but an op-ed by Ravi Ratnasabapthy (Appendix 2) examines the wider issue of overall construction costs – cement makes up only 22% of construction costs. While price controls apply to cement, policy on other construction materials actually raise costs leading to higher overall construction costs. The op-ed, which highlights some aspects of the muddled policies on construction is available in the appendix to this report. iii Price Controls On Pharmaceuticals The survey highlights the following
- Although price controls on
pharmaceuticals has been discussed since the 1970’s their actual imposition was only relatively recently – in October 2016.
- Price controls were imposed on only
48 drugs for common diseases such as diabetes, heart disease, high blood pressure, high cholesterol, and others.
- They were imposed on drugs that
command a 2% or more market share (by volume), and based the median price prevailing in the market at the time.
- The price controls were viewed more
positively by local manufacturers of pharmaceuticals who expected to benefit from lower competition from imports. The importers viewed the policy negatively.
- The report does not reach a firm
conclusion either positive or negative on the controls, which may be understandable given their recent imposition and the lack of time for serious issues to manifest. The full survey is available in Part II of this report.
SOME OVERLOOKED
COSTS OF
PRICE CONTROLS
4 SOME OVERLOOKED COSTS OF
PRICE CONTROLS
How price controls negatively interfere with the market system First published by the Institute of Economic Affairs. Excerpt from “Flaws and Ceilings: Price Controls and the damage they cause.” In addition to the direct and observable effects of price controls – shortages and surpluses – there is also a series of subsequent, indirect costs which emerge. Perhaps the best source for understanding these overlooked costs is to look to those who were directly involved in designing and implementing past controls. One such individual, G. Jackson Grayson Jr, served as the chairman of the Price Commission in the United States under President Nixon from 1971 to 1973. In this role Grayson was responsible for overseeing the implementation and enforcement of Nixon’s price controls. After leaving his post, Grayson (1974) wrote: ‘[a]s a result of my sixteen months as price controller, I can list seven ways that controls interfere (negatively) with the market system and hasten its metamorphosis into a centralized economy’. Grayson’s list can be paraphrased and summarised as follows. (i) Price controls distort economic activity Price controls distort the allocation of resources both directly and indirectly. As discussed in the previous section, the direct effect is to create persistent shortages or surpluses while reducing the number of mutually beneficial exchanges that would have otherwise occurred in the absence of controls. But the implementation of price controls leads to a series of subsequent, indirect distortions as well, as people respond rationally to the immediate and direct effects of the controls. In the absence of the ability to use prices to ration scarce goods, alternative mechanisms emerge. For example, shortages lead to queues resulting from excess demand for the good or service in question. This dynamic was evident in the centrally planned economies of Eastern Europe as well as in the US in the 1970s when the government-imposed price controls on petrol. Long queues tend to lead
to subsequent government interventions with rationing schemes. For example, the US government reacted to long queues for petrol by limiting consumer purchases of petrol to every second day. The emergence of crime and black markets are another indirect negative effect of price controls. Unable to adjust prices legally, producers and buyers may move into the extralegal market to engage in exchange. Others, desperate to obtain goods for which there is a shortage, may engage in theft to obtain goods. To provide one illustration of black market activities, consider the case of farmers in the UK in World War II. Facing wartime meat rationing, many farmers underreported animal births to the Ministry of Food and then sold the additional meat in the black market. Yet another indirect effect of price controls is evasion, which can take on a variety of forms. For example, facing a price ceiling, sellers may charge additional fees or tie-ins to compensate for the fact that prices are required to be artificially low. There is also likely to be deterioration in the quality of the product or service. This may include the substitution of low-quality for high-quality ingredients in the production of a good or, in the case of rent controls, maintenance and investment not being carried out and poorquality conditions being allowed to develop in accommodation. Finally, a legal mandate on prices lowers the cost of buyers and sellers using nonmonetary criteria (e.g. race, gender, religion, etc.) to allocate resources. Price floors will allow buyers to indulge their non-monetary preferences while price ceilings will allow sellers to do so. Consider an example of each to illustrate this. A minimum wage, which is a price floor, will create an excess supply – i.e. a surplus – of potential employees willing to work at the legally mandated wage. In this case employers, the buyers of labour, can indulge their non-monetary preferences in deciding who to hire. For example, they may decide to discriminate against a certain group or type of person in making their hiring decisions. Due to the price control, they are able to indulge these preferences precisely because there is a surplus of potential employees from which to choose. Now consider the case of a rent control: a price ceiling. In this case there will be an excess demand – i.e. a shortage – for flats, which means that sellers can indulge their non-monetary preferences in choosing among potential tenants. Precisely because the price control creates an excess demand, landlords can discriminate and indulge their preferences without suffering a monetary cost for doing so. Turning away certain potential tenants based on non-monetary characteristics does not hurt the landlord because other potential tenants remain due to the artificially low price. (ii) Price controls mask real changes to economic fundamentals Price controls are often implemented with the goal of fighting inflation. But this, incorrectly, assumes that all wage-price increases are the result of inflation. In an unhampered market economy, there are constant, genuine changes to supply and demand conditions that will often lead to real price increases and relative price increases. The existence of price controls distorts the ability of the price mechanism to communicate this information by treating all price changes as if they are the result of inflation. The result is that scarce resources will not be reallocated to meet changes in the real, underlying economic conditions. Thus, due to persistent resource misallocations, standards of living will suffer. (iii) During a period of price controls, the role of profit is neglected, if not entirely ignored Initial calls for price controls – whether from the public or from policymakers – are often justified on the grounds of profits for certain industries being ‘too high’. By implementing price controls, the logic follows, the government can limit profits while passing savings on to consumers. The implementation of controls reinforces the, incorrect, sentiment that profits come at the expense of consumers as opposed to the actual reality that profits flow from the successful satisfaction of consumer wants. Moreover, the implementation of controls discourages long-term investments due to the artificially low prices and a weakened profit motive. We noted above how quality deterioration under price controls will affect customers in the short term as producers respond to the implementation of controls. However, this is only part of the story, as quality deterioration will also affect consumers over the long term. In the face of price controls, suppliers will have a disincentive to invest in either expanding production or improving the quality of the controlled good in future periods. Indeed, the full impact of price controls may not be felt for many years and then become disconnected in the minds of policymakers from the original policy, so that there is little political pressure to reverse the controls. In general, supply is more elastic in the long than in the short run. An energy price control, for example, may lead to a relatively small reduction in supply immediately because the short-run marginal cost of production of energy may be lower than the controlled price. However, the long-run marginal cost will be higher than the short-run marginal cost because the continued production of energy involves investment in new plant and equipment. That new investment might not be forthcoming in the controlled market. This is also problematic precisely because new investment would lower the price of energy in the future, the very end that proponents of price controls claim that they are seeking. Thus, during control periods, the role of profits in rewarding producers for supplying a good that consumers value is weakened if not altogether removed. This discourages increased future production, which only exacerbates the initial perceived problem of ‘too little’ supply at ‘too high’ a price.
Lack of profits and quality in the agricultural sector
An investment with low returns – a case study on farmers.
The Farmer My name is Sumasiri Walisingha and I live in Saliyapura (off Anuradhapura in the North Central Province). I hail from a family of farmers with over 25 years of experience in farming in this district. All my siblings have become farmers, and at present, we collectively farm a total of 16 acres of paddy land. There are no restrictions on us for the farming lands by the government, but the government provides fertilizer subsidies for only 5 acres. Therefore, most of the farmers are limited to less than 10 acres of farming. We used to cultivate different types of vegetables such as snake gourd, okra, and plantains during the seasons in which we could not cultivate paddy, owing to the weather conditions. The rough cost of farming paddy per acre is approximately Rs.6000. Our produce is bought by a middleman who constantly negotiates with us. They hold all power and we are helpless. If they don’t buy from us, we have nowhere else to sell. They negotiate with us stating the government price control on one side, and on the other hand they claim that they have bought rice from other farmers at a particular price. Because of these negotiation tactics, we are unable to obtain a fair price for our produce. Sometimes we have to sell our goods with a Rs.1 or Rs.2 margin. Even though the government announced that they will a provide a good price for farmers, we know how difficult it is to sell our goods to the government; the process is not smooth and systematic. We have to pay for the transport to carry our goods to the government stores and wait in long queues. Sometimes we have to return without even having sold our goods. Rice farming is no longer a popular vocation. The youth strongly dislike being farmers as they have better employment opportunities elsewhere. Furthermore, they know that we do not get a fair price that aligns with the effort and the time we invest. As a result, finding labour becomes a tough task for us during the cultivation periods. Currently we have to pay approximately Rs,1,200 per day (excluding food) to hire labour. Despite the effort we take to cultivate paddy, in having to spend approximately 80% of our cost on labour and on the purchase of seed paddy, the return on our investment is very low. Sometimes we have to get loans to settle labour chargers. At times we make only Rs.500/- per acre. As mentioned previously, the middleman also has the tendency to squeeze our margins, and as a result this becomes a one-sided relationship. In my opinion, trying to control the price of rice does not have a practical application. Even though price control is in effect, there is no reasonable price at which the goods are purchased from the farmers. It is important to look at setting a fair price when purchasing from farmers, as well as to oversee the quality of rice being imported.
A precedent for quality deterioration – a case study on rice importers.
The Rice Importer
I have more than 35 years of experience in being an importer. Our head office and stores are located in the Fort Market. We mainly import rice, dhal, chickpeas, green gram, and spices. We import rice from India, Pakistan, and Myanmar; on average 400,000 kgs. Unlike other products, rice can only be imported when the local production cannot meet market requirement. Currently the government allows the import of rice, having taken into consideration the current weather conditions and subsequent low local production. Even though the government introduced the price control, they never did reduce our taxes. We have to bear the cost irrespective of the price control. Unfortunately, the government controls the selling price without having conducted any investigation into costs. Price control results in the entrance of low-quality products into the market. Consumers cannot recognize these low-quality goods because of their physical similarity with good-quality products. Well established importers do not import low-quality products, but there are low-quality goods plentifully available in the market. We cannot import good-quality products and sell according to the controlled price. Therefore, we refrain from importing goods that are price controlled. We have to change our import portfolio according to the price control mechanism. No one knows which product will face this price control tomorrow. Currently, government regulators only inspect prices, and not the product quality. In my opinion, the government should introduce quality checks for the different products and enforce these controls and inspections regularly. These should be carried out at the port itself, before the goods are offloaded Price control is not a mechanism which reflects the market reality, and it is not at all a practical way of bringing relief to consumers. The price should be automatically decided by the market according to the product quality and market demand.
(iv) Price controls replace market competition with political competition The implementation of price controls does not change the fundamental nature of the economic problem. Decisions still need to be made about how to best allocate scarce resources among an array of feasible alternatives. In the absence of price controls, these decisions are made through the market process, which relies on true market prices reflecting the relative scarcity of resources.
However, with the implementation of controls, the market process is distorted and political competition, at least partly, replaces market competition. Efforts are shifted from pleasing private consumers to attempting to influence the political process, which ultimately determines how controls are implemented and enforced. The result is that price controls attract an array of political interests who seek to use controls for their own narrow pursuits at the expense of the broader interests of private consumers. As Grayson (1974) writes,
‘wage-price controls provide a convenient stone for those who have economic and political axes to grind, particularly those interested in promoting a centralized economic system’. (v) Price controls normalise attitudes of reliance on government Price controls threaten the dynamism of markets, which rely on profit and loss to operate effectively. In the absence of controls, those in business must weigh the perceived risk and reward of alternative courses of action. Misjudgement by entrepreneurs results in losses and, at the extreme, bankruptcy. However, price controls change the decision-making calculus of entrepreneurs. Instead of having to weigh the true costs and benefits of their actions, entrepreneurs come to see government regulators as a potential source of economic security that can insulate them from the often-harsh realities of competitive markets. The result is that ‘[t]he controlled become dependent on the controllers and want regulations continued in preference to the competition of the dynamic market’ (Grayson 1974: 12). The cumulative effect is the replacement of profit and loss as the mechanism for determining winners and losers with an increasing reliance on political authorities for protection from the realities of consumerdriven market competition. Thus, the voices of private consumers are weakened as is the incentive for businesses to make consumer satisfaction a priority. (vi) Price controls generate regime uncertainty The implementation of price controls gives regulators the power to shape economic outcomes. In the unhampered market, businesspeople must attempt to forecast accurately the wants of consumers. Price controls add another element of uncertainty into the process. Now businesspeople must not only anticipate what their customers want but also forecast how regulators will act. This creates ‘regime uncertainty’, which refers to ambiguity surrounding the protection
of property and the stability of rules and regulations in the future (see Higgs 1997). If businesspeople are uncertain about future regulations and controls, their ability to plan and forecast is hampered, which raises the cost of planning and investing. Further, entrepreneurs must shift at least part of their focus to attempting to anticipate what regulators will do in the future. This shift comes at the expense of private consumers who would otherwise be the main focus of for-profit business. (vii) Price controls mask the true causes of economic problems Price controls are typically framed as a response to some supposed market failure. In this scenario, government regulators are seen as the quick-fix solution to perceived problems inherent in markets, which are often, incorrectly, blamed on such things as ‘speculation’ and ‘hoarding’. This overly simplified framing masks the true underlying cause of economic ills. In an environment of high inflation, for example, calls for government-imposed price controls completely neglect the role of monetary policy as a fundamental cause of inflation. In the case of wage controls, a minimum wage may raise the pay for some individuals while leaving other individuals unemployed. The policy may well, in effect, be masking the effects of low productivity caused, for example, by defective education policy. The low levels of productivity will manifest themselves in the form of higher unemployment rather than in the form of lower wages. The ultimate result is that price controls mislead private citizens regarding both the fundamental causes of perceived economic problems and the solutions to address those problems.
Price controls on hoppers and tea : A violation of economic freedom An economically futile pricing regulation: a case study on hopper sales
The Hopper Seller My name is Kumari Priyadharshini. I have been involved in this business for over 10 years. All the family members help out and are involved in this business. We mainly sell rice, kotthu, hoppers, and string hoppers. Our target is to sell 250 hoppers a day. I have to allocate parts of the net income amongst all members involved in this business. The average income for one person is around Rs.40,000 a month. Finding labour to work for long shifts is difficult and very costly. As a result, the family has to get involved in running a business like this in order to compensate for the labour shortage. Everyone assumes that we make a good profit by selling hoppers. But the hoppers are not the main income generator. Hoppers are just a fancy food (‘visithurubandayak’) item which is a crowd-puller. Our main income is actually generated from regular rice and curry, fried rice, and kotthu. We make the hopper mixture for this quantity; whether the hoppers sell or not we make 250 hoppers a day, as we pay the hopper-maker a daily fee of Rs.1,500/-. It is hard to determine the price of a food item because of rising prices of key ingredients. Everything is expensive, from vegetables and rice, to flour and coconuts. Our overall profit has reduced over the past few years due to the increase in prices of food items and ingredients. After the price control was imposed, we sold hoppers for Rs.10/- for about two months and eventually stopped selling hoppers because it was not at all profitable. Thereafter we recommenced our hopper sales at Rs.15/-. In this area, none of the hopper shops follow the controlled price for more than two months because of the cost of production. It is not profitable to sell hoppers at the controlled price. Furthermore, the regulators do not come and conduct price audits at the hopper shops. Customers are not too concerned about the price of hoppers. Rather, they want to be ensured of quality and taste, and do not mind paying a higher price for good quality and tasty food. We have regular customers who visit our shop because of the quality of the food. In my opinion, hoppers are not a staple food item where there is a major impact on consumer purchase power. As I mentioned before, what matters to them most is the quality and the taste. Regular quality checks are more important than price control. We strongly feel that the controlling of prices of food items such as hoppers is purely a government propaganda versus addressing the real needs of the consumer. If this was an actual need of the consumer, there would be a more stringent implementation process. These policies are brought in just to obtain the votes.
A case study of tea sales
The Tea Seller
I have been running this shop for over 15 years. It started on a small scale with only one worker, and today we are a medium-sized tea shop. We mainly sell tea and a range of bakery items, rice, carbonated beverages, and pastries. We sell around 150 to 200 plain tea and milk tea cups per day. We also sell branded tea as there has been an increase in demand. To plain tea we usually add ginger to make the tea suit the local palette. Customers are not satisfied without ginger in their plain tea. The cost of one cup of plain tea is around Rs.12/- to Rs.15/-, and Rs.30/- to Rs.35/- for a cup of milk tea. Therefore, we sell plain tea for Rs.20/- and milk tea for Rs.40/-. Considering this cost, it is not practical to sell tea according to the controlled price. In addition to plain tea and milk tea, customers also ask for malted drinks like Nestomalt and Horlicks; and these we sell at a much higher price. Therefore, the price of a cup of tea is not a big issue for customers. Now most customers ask for branded teas like ‘Nestea’ (Nestle tea), which is selling at Rs. 40/-. They now look for quality and hygiene when it comes to food and beverages. We sell the branded as well as the regular handmade teas at the same price. We stopped selling tea for few weeks after the price control was imposed. After about a month, things returned to normalcy, where no one bothered or questioned about the price of tea. We recommenced sales at the usual price. It is hard to decide on the price of food and beverages because of the rising costs of sugar, flour, vegetables, and other ingredients. We have our fixed costs, like the rent of our shop, electricity, water, wages of employees, etc. This severely affects our margins. Customers visit our shop looking for the quality and taste of tea that we offer. It is trust and meeting the expectations of the customer that are the most important aspects. In my opinion, price control is not needed for a product like tea. Consumers are not concerned about price as much as they care about the quality and taste of the tea.
consequences discussed throughout this chapter,
Conclusion it appears to many that these controls are pure It is not hard to see why price controls are benefit with little to no cost. But the economic appealing. They offer what appears to be a quick way of thinking indicates this is wrongheaded. and simple solution to rising prices and allow As Thomas Sowell (2007) writes, ‘[e]conomists policymakers to provide short-term benefits to have long been saying that there is no free lunch certain groups of people. It is true, by definition, but politicians get elected by promising free that price controls will either raise (in the case lunches. Controlling prices creates the illusion of of a price floor) or lower (in the case of a price free lunches.’ Furthermore, price controls are a ceiling) the price of the good or service in low-cost method for politicians to reward interest question. Further, it is true that not all people are groups for their support at the ballot box. For made worse off by the implementation of price example, in some countries, advocating higher controls. Under a price floor, those who receive minimum wage laws is a well-known method for a higher price for their good or service than they politicians to reward unions for supporting their would have in the absence of the control are made election efforts. better off. Likewise, under a price ceiling, those If the goal of policymakers is to improve
who pay a lower price for a good or service than standards of living, policy must focus on
they otherwise would have are made better off. incentivising improved quality and availability.
Economics, however, indicates that price controls This is accomplished by creating an environment
are far from costless, and the associated costs conducive to economic freedom and contestable
are far reaching and potentially significant. markets where entrepreneurs can experiment As we have emphasised, there are both direct and subject their conjectures to the market test. and indirect costs to price control policies. While Price controls undermine economic freedom some of these costs are seen (such as a shortage and, therefore, must be dismissed as a means or surplus), many are unseen: for example, for improving standards of living. The reality is long-term investments that would have taken that price controls harm the well-being of many place in the absence of controls may no longer while providing political gains to the few. Until the take place because investors fear they will not economics of price controls is appreciated, legally be able to make an adequate return on their mandated prices will remain a viable policy option investment. When one appreciates the complexity despite their historical failure and the significant of the market system, it becomes evident that costs that they impose on the average citizen, who understanding the full consequences of a price suffers under such policies. control is very difficult. What is clear is that price References
controls set in motion a series of unintended consequences as producers and consumers Grayson, C. J. (1974) Controls are not the answer. respond to the new incentives created by the Challenge, November– December. introduction of controls. More often than not, these unintended consequences exacerbate the Higgs, R. (1997) Regime uncertainty: why very problem that proponents of controls claim to the Great Depression lasted so long and why correct. prosperity resumed after the war. Independent Review 1(4): 561–90. The logic of the seen and unseen also helps to explain why, given the costs associated with Sowell, T. (2007) Pricing 101. National Review price controls, they continue to remain popular Online, 21 February.http://www.nationalreview. among politicians and much of the public. Price com/article/220039/pricing-101-thomas -sowell controls are readily observable – i.e. seen – in (accessed 10 March 2015). that the public can readily observe the legally mandated price set by government. Given the difficulty of understanding and tracing the unseen
Public perception
5 Public perception
Survey by Breakthrough Business Intelligence Despite the many claims that government makes on how these price controls are going to benefit all parties engaging in the day-to-day trade of essentials, the reality of the situation can be completely different. This is exactly why perceptions by those engaging in the trade becomes an essential indicator. It will help gauge what they think about the price controls imposed and how effectively their lives have improved as a result of these price controls imposed by the government, which will either validate, or disprove the flowery claims that the government makes. In order to ascertain the impact of price controls on the market, a survey with traders was carried out by Breakthrough Business Intelligence during May – August 2017. This survey covered
Chart 01: Responder profile
Importer Wholesale SME (retail) Tea shop Hopper shop Farmer
How long have you been currently involved in this business?Total Less than 3 years3-6 years Importer Wholesale SME (retail) Tea shop Hopper shop Farmer Total
the geographies of Colombo, Gampaha and Anuradhapura with the aim of capturing trader nuances in cosmopolitan markets as well as in the heart of the paddy farming community. The survey consisted of mixed methodologies of both qualitative and quantitative data capturing methods. The qualitative survey consisted 18 one to one, in-depth interviews carried out with key trade segments and value chain partners who are affected by price controls; namely importers, wholesalers, retailer, tea and hopper shops, bakers and the farmers. The quantitative survey consisted of a sample of n= 182 respondents as per the following breakdown
Over 6 years
A brief introduction of the respondent profile is
recruited based on multiple sampling methods as given below
detailed below; a) Importers – The entrepreneurs involved in importing the products to the country, as well as those involved in wholesale dealing and distribution of the products across the country b) Small entrepreneurs – The entrepreneurs carrying out the small operations in order to supply the price-controlled products to the markets or to the larger companies who process the food products. This sample included the tea, hopper and The qualitative interviews were carried out through bakery shop owners a semi structured interview, conducted by an experienced moderator. Each interview was carried
c) Farmers – The larger audience across out for a minimum duration of 45 minutes.
the country involved in growing most of the price-controlled products, and who Post screening the respondents for their eligibility are most affected by the price control based on predetermined criterion based on regulations the definitions highlighted above, the qualifying d) Wholesalers – The entrepreneurs that sell respondents were invited to participate in the survey.
large quantities of products to retailers and small entrepreneurs. Wholesalers The quantitative survey was carried out through mainly received products from importers face to face interviews which were carried out by and from the middle man who take goods trained enumerators. The respondents were once from producers (eg: farmers) again screened for their eligibility to take part in the survey.
e) Retailers – The entrepreneurs who operate in small and medium scale, Each interview was carried out for an approximate that directly supply goods for the end duration of 45 minutes. The research tools i.e. customers survey questionnaires were designed based on the qualitative feedback received and were translated
The sample constituted a total of 182 to the local languages and back translated to
respondents; including 25 importers, 30 English to ensure accuracy and usage of correct
wholesalers, 29 retail shops, 38 tea and hopper shops, and 60 farmers. The sampling method used lingo. for this report was random sampling, in order to What are price controls? When were they ensure the most reliable results that accurately imposed? represent the real-world scenario. One major concern our society has to face is the The survey respondents were recruited using asymmetry of information; which leads to citizens the sampling methods of judgemental and not gaining an adequate understanding of the convenience based methodologies for the policies passed by the government they have to qualitative phase. The identified respondents were abide by. This truth also applies to price controls. screened for their eligibility to take part in the survey and their ability to articulate the impact of The need to question the target audiences on price controls. their understanding of price control was owing to discovery made during the qualitative phase. The respondents of the quantitative survey were
a) Importers – Non random sampling method of snowball sampling b) Small entrepreneurs – Random sampling c) Farmers – Random sampling d) Wholesalers – Non random sampling method of snowball and judgemental sampling e) Retailers – Random sampling
Some of the value chain patterns interviewed during the qualitative phase exhibited a degree of confusion between the maximum retail price (MRP) and the price ceiling enforced by the government. Hence, it was deemed important to quantify the understanding of the value chain partners had, on a law which affected them. It is noteworthy that when most respondents across all segments surveyed were asked to define interesting to note the varied responses provided the concept of price control, there were mixed opinions. In order to ascertain the impact and the reflecting the confusion which may exist as a practicality of the application of price controls, the respondents who were not able to articulate correctly the definition of the concept were explained what price controls meant. Wholesalers Interestingly, 2/3 the wholesaler segment were
rd able to correctly define the term as they were constantly subject to checks and scrutiny by the government officials to evaluate their degree of compliance. Chart 02: What do you understand by the term ‘price controls’ imposed by the government?
Government mandated legal goods Maximum retail price (MRP) of products No proper idea
Clear levels of awareness exist with regard to the subject
Price controls have been introduced to various product categories over a few years. This has resulted in a certain degree of confusion amongst the wholesalers as to when exactly the price controls have been in effect. This in turn questions the degree of compliance as they were unable to correctly specify when the price controls were imposed. Once again it is
by the wholesalers in answering this questions,
result of revisions of price controls and changes in taxes. Graph 01: When did the government introduce price controls on the products you sell? Retailers
Within this year
Before 1 year
Before 1 ½ years
Before 2 years
Over 10 years
Similar to the results seen amongst the wholesaler segment, understanding of the retailers with regard to the concept of price controls was lacking. The survey results indicate that only 52% of the sample were able to correctly define the meaning of the term price controls. The inability to clearly differentiate between the terms of MRP and price controls could be owing to government authorities checking the retailers for two aspects of compliance. One hand they are subject to scrutiny with regard to their adherence to the imposed price controls whilst on the other hand, they are also subject to checks with regard the retailers correctly and visibly displaying the maximum retail price at
Tea & Hopper shops
which products can be sold at. It was stated that non adherence to both these regulations resulted Although a little more than half the sample were in a penalty being imposed on retailers. able to define the meaning of the term price controls, 1/5 of the sample had no proper idea of Chart 03: What do you understand by the term the term. Whilst a majority seem to be clear with ‘price controls’ imposed by the government? regard to the floor price, the degree of confusion continued with this segment owing to similar reasons as retailers. The penalties imposed owing to lack of adherence to MRP and non-display of price boards seems to be contributing to the degree of confusion which prevails in the market. Chart 04: What do you understand by the term ‘price controls’ imposed by the government?
Government mandated legal goods Maximum retail price (MRP) of products Noproper idea
Graph 02: When did the government introduce price controls on the products you sell?
Within this year
Once again there was a degree of confusion Before 1 year which prevailed as to when the price controls were in place.Needless to say, the lack a clear Before 1 ½ years understanding of the concept resulted in the period in which it was being imposed being Before 2 years associated with different periods of time. According to most retailers, it can be agreed that price controls have been imposed more than 2 years ago.
th
Government mandated legal goods Maximum retail price (MRP) of products Noproper idea
Graph 03: When did the government introduce price controls on the products you sell?
Within this year
Before 1 year
Before 1 ½ years
Before 2 years Announced every year, but not continouing
There appears to be divided responses as to when the latest price control was imposed.
Importers Data suggests that there is a lack of comprehension among the majority of importers, exhibiting similar trends to other segments, in defining and comprehending the term price controls. Similar trends exits with regard to the period in which it was imposed Chart 05: What do you understand by the term ‘price controls’ imposed by the government?
Government mandated legal goods Maximum retail price (MRP) of products No proper idea
Graph 04: When did the government introduce price controls on the products you sell?
Within this year
Before 1 year
Before 1 ½ years
Before 2 years
Farmers Majority of the farmers affected by the government imposed price control where middle man or the mill owner starts to bargain their goods. Their knowledge is based on the information that brings to the village by the middle man or the mill owner. Chart 06: What do you understand by the term ‘price controls’ imposed by the government?
Government mandated legal goods Maximum retail price (MRP) of products No proper idea
58% of whole sellers believe that the government
Lack of knowledge and the awareness may leads is benefitting by price controls, and another
towards to the confusion on the time period that 6% is of the opinion that no one benefits. It is
government imposed price control. noteworthy, that the traders perceived government Graph 05: When did the government introduce to be the beneficiary of price controls perceived it price controls on the products you sell? to be more of election propaganda as opposed to a measure which benefits the customers. Overall, price controls are viewed to be a Within this year burdensome regulation by the government by more than half of the sample Before 1 year Tea & Hopper shops Before 1 ½ years Graph 07: In your opinion who is benefitting from Before 2 years government imposed price control? Announced every year, but not continouing
This segment appears to have no clear idea with regards to the time period of the recent imposition
Who benefits from price controls? This section includes the views of stakeholders on who are the beneficiaries of price controls. The respondents were asked to name all beneficiaries (multiples answers) on whom they perceive to be benefitting from the imposed price controls. Wholesalers & Retailers However, an overwhelming 60% of tea and hopper salesmen surveyed believed that customers stand Graph 06: In your opinion who is benefitting from to benefit the most from price controls. government imposed price control?
0%0%0%3%
Importers Graph 08: In your opinion who is benefitting from government imposed price control?
Similar sentiments to the tea and hopper segment were expressed by the importers with regard to stating the beneficiaries of price controls. A majority of the sampled importers stated that the customers’ benefits whist 40% stated the government. The government was seen as imposing price controls to gain voters confidence as opposed to looking at the best interest of consumers or traders. Importers are of the belief that customers stand to gain most, followed by the government.
Farmers Graph 09: In your opinion who is benefitting from government imposed price control?
It is interesting to note that the farmers were most single minded in stating the key
beneficiaries of price controls. A little over 2/3
rd of the sample perceived that customers were the clear beneficiary. It is also noteworthy; they don’t view themselves as one of the beneficiaries. Notice that the stakeholders closer to the point of buying are the ones who believe that the people they are selling to benefit the most. Closer to the point of buying is where the control price will have its impact the most. Wholesalers on the other hand, believe that the government benefits; they are further away from the point of sale. The experience of dealing with the government Since the government passed these laws and are keen on enforcing them, this part of the study looked into whether the government has been able to treat everyone equally. Once again, despite the claims the government may make, the respondents are in the best position to testify to these claims. A general sense of reluctance was witnessed in answering this question as the enumerators were perceived as undercover agents of the government who was looking prosecuting the traders. Wholesalers Graph 10: How often do government authorities audit/ visit to audit price controls?
3%3%
DailyWeeklyOnce a MonthlyOnce in Twice a AnnuallyHardly Never every 2 -3 fortnight year come to come to months checkcheck
The survey revealed that wholesalers have been heavily targeted by government authorities. The data suggests that authorities make frequent visits to audit the controlled prices and the price displays. A majority of the sampled stated that the audits took place ranging from daily checks to one in every two to three months.
Importers
Retailers Graph 12: How often do government authorities
Graph 11: How often do government authorities audit/ visit to audit price controls?
audit/ visit to audit price controls?
7%7% 0%0%0% DailyWeeklyOnce a MonthlyOnce in Twice a AnnuallyHardly Never every 2 -3 fortnight year come to come to months checkcheck
Government authorities regularly visit over 60% of the retailers sampled. According to the retailers, government authorities visit at least every quarter The government has largely implemented a to audit the control prices and the updated price successful monitoring system which audits the displays. wholesalers and retailers. However, with tea shops and hopper shops, there is no evidence that the Tea & Hopper shops government conducts regularly audits. This could be perhaps owing to this industry operating in the Graph 12: How often do government authorities domain of micro enterprises, scattered across a audit/ visit to audit price controls? large geography and in turn the lack of practicality of conducting audits. There is a direct positive correlation between how often the government checks up on these stakeholders, and the chances of them being fined. It is important to note that farmers sell their produce to the middlemen who use the price 7%7% controls to their advantage. Intense bargaining 0%0% takes place between farmers and middlemen; often the buyers stating that they need to sell
DailyWeeklyOnce a MonthlyOnce in Twice a AnnuallyHardly Never every 2 -3 fortnight year come to come to months rice based on the floor prices. Often the farmers
checkcheck are unable to stand against the heavy bargaining Despite price controls being imposed, it is power of the buyer and supply their paddy at extremely interestingly to note that tea and prices dictated by the middlemen and / or mill hopper shops were hardly audited. This is a owners. clear indication of how inconsequential the price controls are on this segment as customers are The price at which the farmers sell their paddy driven by the quality of what’s offered versus the does not come under scrutiny of audit process price of the consumable. of the government authorities as their interest lies with the end price at which the consumers purchase a kilo of rice. The price audits hence takes place with the retailers.
DailyWeeklyOnce a MonthlyOnce in Twice a AnnuallyHardly Never every 2 -3 fortnight year come to come to months checkcheck
Polarising responses can be observed as importers are not heavily targeted.
Graph 13: Current steps and future actions in response to price controls in a snapshot
In response to the controlling of prices, retailers tend to adjust prices temporarily since price controls are mainly applicable at a detailed level. Importers simply source cheaper goods where it can be sold to the retailers at an affordable rate for them to sell back. The closer you are to the point of sale, the more likely you are to temporarily change prices, pay a fine, and then continue with the current market price. The data clearly indicates the vicious cycle of price controls. Importers bring down poor quality products, and retailers temporarily adjust prices or sell it at the price that they can afford to sell. Consumers just have to live with poor quality products even due to market distortions by the price controls. If prices are kept free, and if certain products are increased, people will consider substitutes.
Wholesalers Graph 14: What steps are you currently taking in order to adhere to the government imposed price controls?
Temporarily adjust the selling price
Source for low quality, cheaper products
Stop selling goods that imposed price control
A little more than one-third of the market was looking at cheaper means of sourcing. Only a minority is looking at innovation.
Graph 15: What future actions do you hope to take if exposed for not having adhered to imposed price controls?
Stop selling goods
Given the insignificant penalty, they prefer to continue with business as usual. However, increasing the penalty will cause complete stoppage of selling the specific product. Retailers Graph 16: What steps are you currently taking in order to adhere to the government imposed price controls?
Temporarily adjust the selling price
Source for low quality, cheaper products Stop selling goods that imposed price control
Retailers claim that they are likely to fall in line. The socially desirable response is clearly stated.
Graph 17: What future actions do you hope to take if exposed for not having adhered to government imposed price controls?
Stop selling goods
The actual behaviour is reflected here. Once again business will resume as usual. Tea & Hopper shops Graph 18: What steps are you currently taking in order to adhere to the government imposed price controls?
Temporarily adjust the selling price
Source for low quality, cheaper products
Stop selling goods that imposed price control
A temporary price adjustment is opted for by this segment. Graph 19: In order to adhere by price control, what are the innovative actions that you take?
Graph 20: What future actions do you hope to take if exposed for not having adhered to government imposed price controls?
Stop selling goods
A clear indicator that price controls won’t work for this segment of retailers and small businesses.
Importers Graph 21: What steps are you currently taking in order to adhere to the government imposed price controls?
Source for low quality, cheaper products
Temporarily adjust the selling price
Look at bringing down the cost through
Stop selling goods that imposed price control
Cheaper products entering the market seem to be an accepted practice. Perhaps this could have been triggered by constant price controls imposed by the successive governments. As suggested by data, getting through the system seems to be the preferred option by importers. Graph 22: What steps are you currently taking in order to adhere to the government imposed price controls?
How does the enforcement of price controls affect market outcomes? The main problem associated with such price controls is that it may bring about uncertainty. Thus, the challenge is in figuring out what the outcome in the market would bethe final aspect this study focuses on. Wholesalers Graph 23: Summary of trader responses to price controls It is clearly evident that the market will be flooded with cheaper products.
Retailers Graph 24: Summary of trader responses to price controls In reality, in the qualitative phase, these innovations are changing the scale to weigh lesser in quantities or
by adding impurities to further downscale the quality.
Tea & Hopper shops Graph 25: Summary of trader responses to price controls
cheaper products The players are looking brining the cost
foreign players / suppliers local players / suppliers Business will decline & more issues for small entrepreneurs
Innovativeness has been adhered to as a measure of profit maximization by hopper and tea shops.
Importers Graph 26: Summary of trader responses to price controls
cheaper products
foreign players / suppliers The players are looking brining the cost
local players / suppliers Business will decline & more issues for small entrepreneurs
The majority seems to be talking about what they currently do, and are likely to continue doing.
All stakeholders assume that there will be a
the Bombay onion importer, they prefer to charge significant drop in the quality of products with the a higher price whilst paying the fine of Rs.5000/- emergence of floor prices. Despite a majority of
charged by the consumer affairs authority. In the stakeholders believing that the control prices
other words, not only does the importer see profits are likely to benefit the end consumer, a drop in
fall because of the fine, but the consumer will see the quality of what ‘s purchased will infact not
their consumer surplus fall considerably as well. result in benefitting the consumers. At the same time, the price controls lead to This needs deliberation as bringing in floor prices
other spill-over effects. This is in the form of the does not really benefit the party that it meant
emergence of the black market, because sellers to benefitowing to inferior products flooding the
may opt to look to undercover means to charge for market. Lack of reluctance to invest in innovation higher prices and gain higher profits. At the same from the value chain partners is an aspect
time, because of poor government efficiency, there which needs be taken into consideration by the
is a vast shortage of perfect information for both authorities.
buyers and sellers on price controls, which have led to market failure. Conclusion We recommend abolishing the price controls The net effect of price controls is that it leads entirely in order to avoid such negative effects. to a multitude of problems. On the one hand, In its place, let the free market decide the most the domestic producer loses in the form of efficient allocation of resources, and at the market declining profit, which means that the chances price determined by the forces of demand and for profit to be retained for further investment are supply, will be the point where the producer and substantially lower. At the same time, just because consumer surpluses are maximised. In other the price control exists, does not necessarily mean words, only at this point will consumer and that the consumer benefits. As seen in the case of producer welfare be maximized.
Annex
Part 1 Methodology The methodology used for this report had a two-pronged approach; a qualitative phase and a quantitative phase. The qualitative phase includes a series of closed-ended questions from a select group of respondents. The idea was to gain an opinion on price controls and the impact of price controls on a select group of stakeholders. These respondents include the following stakeholders. a) Importers and traders – The entrepreneurs involved in importing the products into the country, as well as those involved in wholesale dealings and distribution of the products across the country. b) Small entrepreneurs – The entrepreneurs carrying out the small operations in order to supply the price-controlled products to the markets or to the larger companies who process the food products. This sample included the tea, hopper and bakery shop owners. c) Farmers – The larger audience across the country involved in growing most of the pricecontrolled products; those who are most affected by the price control regulations. d) Wholesalers – The entrepreneurs that sell large quantities of products to retailers and small entrepreneurs. Wholesalers mainly received products from importers and from the middle man who take goods from producers (eg: farmers). e) Retailers – The entrepreneurs who operate in small and medium scale, that directly supply goods for the end customers.
The achieved sample constituted of 18 respondents; includings3 importers, 12 small entrepreneurs, and 3 farmers. Respondents for qualitative phase Importers Small scale Entrepreneurs Farmers Total
The quantitative phase of the report included quantifying the insights gathered in the qualitative phase, by expanding the sample of respondents to a total of 182. The responses were then analysed using charts and graphs to observe any trends and tendencies. Information was gathered from the larger sample via a face-to-face survey.
Respondents for quantitative phase Importers Wholesalers Retailers Tea and Hopper Shops Farmers Total Both surveys required random sampling to be the sampling method used. This is because random sampling allows for the best possible chances to gain results that will be representative of the real-world situation.
PART II
INDUSTRY SURVEYS ON
PRICE CONTROLS
These surveys of industry were commissioned by the Advocata Institute and are published as Discussion Papers. Discussion Papers are published to stimulate a discussion on the subject of price controls in Sri Lanka. Viroshan Tissera and Trisha Peries contributed to the reports.
THE CEMENT SECTOR
Overview of the Cement Industry Introduction The Cement industry in Sri Lanka consumed approx. 6 million MT’s of cement in 2016. The industry which provides a pivotal role in supporting the construction activities in Sri Lanka, has grown in importance since the post war period. In line with this, the consumption of cement which is a key input for the sector has more than doubled in the period post the end of civil conflict. Graph 1 – Cement usage has nearly doubled in the post war period
2012-2015 CAGR – 3%
2009-2012 CAGR – 23%
Source: Survey of construction industries report
Demand Key users of cement Cement, being a derived demand, arises from the demand from construction. There are broadly, three groups of consumers for cement. They are namely;
- Households – Construction and
refurbishment of households by individuals
- Private Sector – Large scale private sector
developments such as Hotels, Apartments
- Infrastructure projects – Government
infrastructure development projects such as Roads, Bridges
Graph 2 – Nearly a quarter of raw materials consumed is accounted for by cement
It is clear from the graph above, that cement accounts for a significant chunk of the raw materials consumed across the different groups of consumers. In terms of the volume of consumption, households account for the bulk of the cement consumed in Sri Lanka. As per company estimates, in 2016 the households and private sector accounted for approximately 75% of cement demand while the remainder was accounted for by the public sector. Demand can also be segmented based on the form in which cement is demanded. In the case of households, cement is typically purchased in their bagged form. The most common form of cement; Ordinary Portland Cement (OPC) is available as 50kg bags. Bagged cement is usually purchased from retail or wholesale channels. In this context, cement is perceived by the end user as more of a “good”. In the case of large scale developments by the private sector, as well as large scale infrastructure projects in the case of the public sector, cement is purchased in their un-bagged “loose” form. In such cases, loose cement is usually supplied directly by the cement manufacturers. In addition to the cement, they also typically provide silos for the storage of cement, equipment such as cement mixers as well as advice on the optimal application of cement. Therefore, in this context, cement is generally perceived by the end users as cement to the local market by importing bagged a “service”.
cement. In this report, cement firms that possess either the 1 or 2 type of plant that is based in Demand Outlook Sri Lanka are termed as ‘local manufacturers’ while any firm that only possess the ability to A slowdown in construction activity, and hence bag cement locally or import bagged cement are cement demand, was witnessed in 2015 as a classified as ‘cement importers”. number of mega infrastructure development projects were temporarily halted for review. Key Players However, with the recommencement of many of these projects in 2016, as well as the continued
Given the high start-up costs and constrained private sector demand due to growth in the
supply of raw materials which are found in limited tourism and real estate segments, analysts expect supply in the local market, Sri Lanka’s Cement a second phase of high growth for the sector is
industry can be termed as an Oligopoly with in the offing. Looking ahead, firms expect with
the top five firms accounting for approximately. the recommencement of a number of mega
90% of cement demand, while three producers development projects, the public sector will
accounting for approximately 70%-80% of the increase its share of cement demand to 30% in
market demand. Domestic Manufacturers–Only two firms Supply
manufacture cement domestically; Insee Cement and Tokyo Cement PLC. Insee Cement, which Classification of firms manufactures the well-established brand of Sanstha Cement, is the only cement manufacturer
The supply of cement can broadly be classified that possesses an integrated grinding plant in
under local cement manufacturers and cement Sri Lanka; located in the Puttalam District where
importers. However, this distinction is less clear limestone deposits are found, as well as a grinding
cut as there is no cement manufacturer currently plant that utilises imported clinker. Tokyo Cement,
operating in Sri Lanka that exclusively retails which manufactures the Nippon and Tokyo super
cement manufactured domestically. Hence, the brand of cement, uses imported clinker at its plant
classification is based on the weightage given located in Trincomalee. In addition, both local
to the nature of the activities that they engage manufacturers also possess bagging plants to
in and the type of cement plants they operate. supplement their domestic cement manufacturing
Manufacturers broadly operate three types of capability. Regarding cement importers, large
cement plants. They are: global manufacturers such as Ultra-Tech possess
- Integrated Grinding Plants – These are
bagging plants at key ports in Sri Lanka, while plants where limestone, which is the other players such as Lucky Cement exclusively primary raw ingredient for cement is import bagged cement. quarried, is refined into clinker and then processed into the finished product.
- Clinker Grinding Plants – These are plants
where the chief input is clinker, which is in turn used to manufacture Cement.
- Bagging Plants – These are plants where
cement in bulk (either imported or locally produced) is bagged into standard 50kg bags. Apart from the above, a number of firms supply
st nd
Graph 3 – Production Capacities of the top 3 cement players in Sri Lanka
* Includes both cement grinding capacity as well as bagging capacity for imported cement ** Tokyo’s capacity includes the additional 1mn MT’s capcity which was expected to have come online by end 2016 Source: TKYO Annual report 2016, Holcim Annual report 2015, Ultratech cement Lanka website
Domestic Manufacturers Cement Imports – Cement is imported in their bagged or bulk form primarily from South-Asian markets such as India and Pakistan, as well as South-East Asian countries such as Malaysia, Thailand, and Indonesia. Currently, Sri Lanka offers zero-duty tariff concessions on bulk and bagged cement imported from India and Pakistan under their respective Free Trade Agreements. For other countries, cement imports were subject to a customs duty of 7.5%. However, in 2015 the government in its interim budget removed the customs duty, and hence a level playing field prevails with regards to the import of cement. Supply Outlook Sri Lanka currently has no restrictions on the import of cement, and hence any shortfalls can be quickly remedied with cement imports. In contrast, expanding domestic manufacturing is more constrained. Apart from the long gestation period required to construct a grinding plant (1mn MT capacity grinding plant takes on average of 3-4 years to complete), the scope for expansion is also limited due to geographical limitations. In order to ensure its viability, a cement grinding
plant is typically operated in close proximity to either limestone deposits in the context of fully integrated plants, or is located close to a port in the case of grinding plants. With respect to the latter, Sri Lanka’s limestone deposits are limited and geographically concentrated in few areas. The only large-scale limestone deposit which would facilitate large-scale development, would be the limestone deposits located in Kankasanthurai (KKS) at the now defunct KKS plant. While attempts have been made in the past to reconstruct the KKS manufacturing plants, these endeavours have been stymied so far as the economic viability of the quarrying is in question. The scope for setting up cement plants at ports is also limited due to both space constraints at existing ports, as well as due to a government policy introduced in October 2013 to limit the number of cement factories to one per port (Source: Tokyo Cement annual report 2014). Hence, we believe that the majority of cement demand will be met by greater levels of imports by either existing domestic cement manufacturers or new cement imports from the region. Introduction to the Regulatory Environment for Cement in Sri Lanka There are broadly two types of regulations that are of relevance to the cement industry. Namely :i) Maximum retail price (MRP), and ii) Quality standards. Price Controls The Consumer Affairs Authority (CAA) enforces a maximum retail price (MRP) on all bagged cement retailed in Sri Lanka. The uniqueness of the MRP regime on cement in Sri Lanka, is that the MRP imposed on a 50kg bag of cement varies by the type of cement and by the manufacturer/ importer. The MRP is imposed on both domestically manufactured and imported cement. Revisions to the MRP is also unique, as the process for changing the MRP is made by representations provided by the individual cement manufacturers or importers directly to the CAA. The revisions are made on the basis of the cost structures of each manufacturer and importer, and takes into account cost factors such as allowed to import cement. Most domestic cement clinker prices, currency movements, electricity manufacturers are of the view that the quality charges, etc. After a period of negotiation, the CAA standards are appropriate in preventing submay revise the MRP for a given manufacturer/ standard cement from entering the market. importer across all of its products. The typical Analysis of the Impact of Price Control sequencing of price revisions is if there is a general increase in cost factors that are felt Introduction across the board by different firms; they could After going into detail with regards to the various make representations to the CAA, who would then elements pertaining to the cement industry in Sri after a period of review decide to revise the MRP Lanka, in this section we provide an analysis of the selectively or across the board. impact of MRP on cement prices on the cement “There were five applications demanding a price industry in Sri Lanka. In the firstsection, we revision. We have appointed a committee to look into investigate the views made by varied stakeholders it, and they will decide whether a price revision is really on the consequences of the current regulatory required.” environment for cement.
- Consumer Affairs Authority (CAA) Chairman Rumi
Marzook
In the secondsection, the impact of price revisions to cement on various stakeholders is examined by Graph 4 – Maximum Retail Price (MRP) for varied taking a closer look at the 2011/12-2013 period cement brands* when a significant revision in the MRP of cement took place. In the final section, we offer some insights as to what we believe the impact might be if price controls are removed from cement. MRP and its Consequences MRP and Building costs Graph 5– Price indices of building materials (100 =2002) – cement has seen a slower growth in price
*MRP in effect as at 01 June 2016 Source: Consumer Affairs Authority
Quality standards Both domestically manufactured and imported cement is subject to meet a number of technical requirements and quality standards set by the Sri Lanka Standards Institute (SLSI). Given the nature of cement which has a limited shelf life, meeting certain technical specification such as the level of As illustrated above, compared with the cost strength of the cement is a key aspect of ensuring inflation that has been experienced by most of the quality of cement. As an additional precaution, the other building materials, the price inflation only firms that are registered with the SLSI are
Source: CBSL Monthly bulletin of cement has been more constrained and may be attributable to the MRP regime that inhibited significant price revisions from occurring. It is clear that while many of the building material trended upwards in the post war period, cement price revisions were more constrained; in line with the government administration’s policy at the time, where a key focus was on improving the infrastructure of the economy. As shown in section 1.1.2, nearly a quarter of the input requirement of large scale infrastructure projects such as roads, bridges etc., is accounted for by cement. Hence, the intention of the administration at the time may have been to facilitate this endeavour while limiting the cost pressures. However, despite this, a significant upward revision in cement prices occurred in the years 2012 and 2013, with the MRP on OPC cement growing by 13% and 10% respectively over the period. This was primarily due to significant regional demand for limestone and cement from countries such as India, Pakistan, and Malaysia, feltduring the period which led to supply constraint. This factor, coupled with the high demand arising from the post war construction demand which created strong demand for cement, even led to shortages in certain period (Source: Daily Mirror). Most stakeholders are of the view that significant revisions to the price of building materials has a detrimental impact on the construction industry. Commenting on the cement price hike which took place in 2012, The President of the Ceylon Institute of Builders,RohanKarunaratne, had advised against measures taken to hike cement prices. (Source: Sunday Times). “Construction stopped at the last price increase, but most of the clients, later agreed to continue with the work after reconciling themselves to the increased cost. However, this time, it’ll be that much harder to convince them because this is the second increase within six months.”
- KapilaRathnadissanayake; a small-scale contractor
In addition, an outsized impact of a significant price hike in building materials is felt by small scale construction contractors who may be forced to absorb the cost increases and bear the losses themselves, or else risk a delay or abandonment
of a construction project which threatens their sustainability in the industry. MRP and domestic production vs. imports Graph 6– Clear shift in the production mix from domestic to imports
Source: CBSL Social Statistics report
While the MRP of Cement has gradually been revised higher, cement supply has come to increasingly rely on the importation of bulk and bagged cement to meet local demand. As of 2014, imports accounted for 70% of the cement supply in Sri Lanka. A dip in imports was witnessed in 2015, which may be due to the slowdown in construction activity during the year as a result of the temporary halting of some of the large-scale infrastructure projects. By 2016 and 2017, cement imports are expected to have increased alongside the greater activity in the construction sector. The prime reason for the dip in domestic supply of cement over the period, is the lack of investment by firms towards increasing domestic cement manufacturing capacities. For example, Tokyo Cement’s manufacturing capacity which stands at 1.4 million MT’s per annum, has remained unchanged until the end of the financial year of 2016/2017 where the firm invested in an additional 1 million MT capacity. Cement manufacturers claim that the existing MRP regime on cement is a key inhibitor to greater domestic cement manufacturing.
In the context of cement and the construction
“The price ceiling for bag cement is preventing market-based pricing by the Company and valuable industry, this is of significance given that the management time, that can be utilised much more application of sub-standard cement to the productively, is spent on policy. This situation is holding back the Company from its potential to create value for construction process would be felt long after and stakeholders” could have long lasting consequences. Cement in particular, is a sensitive product where it must be
- A.S Gnanam, Managing Director, Tokyo Cement,
kept in an elevated position in a dry environment Annual report 2016 and which typically has a maximum shelf life of One economic argument as to why domestic
2-3 months. production has been slow to take off which could In the case of the cement industry in Sri Lanka, be attributed to the imposition of the MRP, is such a situation arose in 2012, when certain that as a result of this, the margins of cement products were pronounced by the Sri Lanka manufacturers are constrained and hence their Standards Institute (SLSI) to be of low quality ability to generate surplus returns which can (Source: Daily Mirror). The possibility of low quality in turn be used to reinvest in the business and cement imports is one of the prime reasons for increase the firms plant capacity is limited. the domestic cement manufacturers to call for the However, given the high start-up costs associated restriction of cement imports. with the plant, its long gestation period as well as geographical constraints that were highlighted in the supply section of the report, could also be significant factors which constrain the expansion of domestic cement capacity. For example, Tokyo Cement’s 1 million MT capacity expansion is estimated to have cost USD50 million with a gestation period of 2-3 years (TKYO Annual Report However, at the same time, domestic cement 2014). Further, from the perspective of a global manufacturers also do believe that the existing cement manufacturer with globally dispersed regulatory environment and the minimum plants, given Sri Lanka’s limited access to quality standards that are imposed on cement limestone deposits and high costs associated with is adequate. A representative of a cement firm the transport of clinker and other raw materials, stated that the MRP does not in general lead to the case for setting up a domestic cement the proliferation of low quality cements flooding manufacturing plant is less compelling than the the market given that the SLSI’s standards are case for setting up a cement bagging plant in adequate and rigorously enforced. In fact, the Sri Lanka; with bulk cement being imported from situation of low quality cement imported in 2012, regional plants such as from India which enjoys arose not due to the MRP -which in fact had scale benefits. subsequently been revised up during that period-, but due to the high demand for cement arising
MRP and Cement quality from the construction activities taking place at the The relationship between MRP and its impact time which resulted in a cement shortage. on the quality of a product can be illustrated as The SLSI has in fact been quite proactive with
follows. In a well-functioning market, the price is regard to preventing the entry of sub-standard
used to signal a product’s quality. The imposition cement into the domestic market despite the high
of an MRP inhibits this function to a certain extent. In a situation where an MRP is too strict or demand experienced in 2011/12, which had even earned the ire of the cooperatives and Internal
is unresponsive to changes in the cost structures trade Minister at the time; Johnston Fernando for
of firms that produce the product, it creates an incentive for firms to offer a sub-standard product not releasing cement into the market (Source: Daily Mirror).
in order to enjoy higher profitability margins.
“An unequal playing field has been created through the current national policy that imposes price controls on cement, while allowing unlimited, duty free entry for imported varieties.”
- A. S Gnanam, Managing Director, Tokyo Cement,
Annual report 2016
In addition, the problem of low quality cement is less of a concern when it comes to large scale infrastructure projects, as the end users are more cement where the relevant MRP, the technical knowledgeable of the technical specifications of the cement, and where cement is viewed more as a service rather than a product;hence cement suppliers are chosen on this basis. All in all, varied stakeholders are generally of the view that the regulatory environment that ensures the quality of cement is adequate. MRP and Cement Shortages Another consequence of the MRP is that it may give rise to a situation of excess demand, leading to shortages. In the case of Sri Lanka, such a situation arose in 2012 where cement shortages were experienced at certain points of the year. In a market-based system, this would lead to an upward revision in the prices, which would then spur a greater supply of cement to meet this excess demand. Given the limits of Sri Lanka’s domestic cement manufacturing capacities, it must rely on imports to make up for any shortfalls in demand. However, the case for importing in the context of an MRP may be less desirable even in a situation of excess demand, as the MRP curbs the returns to importers. This was the situation that arose in 2012 as importers from Pakistan and India -which are the chief source markets for cement imports to Sri Lankahad found more lucrative opportunities elsewhere, given the strong regional cement demand that was experienced over the same period. In this situation, several importers had appealed to the CAA to increase the optimum price of cement, but given the delay in implementing the revised price, the cement shortage was prolonged over this period. (Source: Daily Mirror) MRP and Hoarding Another consequence of an MRP is that it could result in hoarding of stocks by suppliers as they attempt to anticipate a possible revision of the MRP. This could in turn cause a temporary shortage of cement. In order to prevent such a situation from arising, a strong regulatory environment must be in place, and as a result, resources are expended on the state to ensure
that the MRP is enforced vigorously. In the case of cement, the MRP is only applicable to bagged
specifications of the cement, the quality standard of the cement, and the manufactured date of the cement, must be stated on the cement bag. Hence the CAA must ensure that such criteria is met. “We have already taken legal action against 10 cement dealers for hiding stocks. Our teams have been on the ground since Saturday (September
- investigating into the reports and we found about
200 bags of cement that were hidden in stores.”
- CAA Chairman, Rumi Marzook
Consequences of a cement price hike Graph 7– Cement Prices over time
Source: CBSL Annual report
Households – Construction activity slows Based on the number of housing approvals, it is clear that the number of housing approvals which had recorded a strong growth in the immediate post-war period slowed down sharply in 2011/122013 period with the year-on year (YoY) change in housing approvals being limited to 6% YoY in 2012 and -4% YoY in 2013. This slowdown can partly be attributable to the sharp increase in building material prices, including cement, as well as due to an increase in borrowing costs which rose over the same period.
However, despite the volatility in its earnings,
Graph 8– Housing activity slows from a gross and operating margin perspective, margins trended up during FY13-FY14 period. Graph 10Tokyo Cement revenue vs profitability
Source: CBSL Monthly bulletin Graph 9– Borrowing costs trended up over the Graph 11Tokyo Cement – margins trending up same period
Impact of the removal of the MRP on Cement Based on the above assessment of the structure of the cement industry in Sri Lanka, there are several scenarios that can play out. Source: CBSL Annual report Cement prices – Higher Cement Manufacturers – Revenue slows while Graph 12Cement imports enjoy a cost
profitability improves advantage Taking into account the financial performance of Tokyo Cement Company (Lanka) PLC, which is the only publicly listed cement manufacturing company in Sri Lanka over the 2012-2013 period, the firm’s performance was impacted noticeably. Over this period, revenue growth slowed during FY13-FY14 which may partly be on account of a slowdown in demand due to higher cement prices. Contemporaneously, core operating profit growth which excludes any extraordinary gains or losses during the period, was more volatile with a 65% YoY growth in FY13 and a -23% YoY dip in FY14.
Source: TKYO annual reports
Source: TKYO annual reports
Source: CBSL Social Statistics
As highlighted by the stakeholders of domestic cement manufacturers, there is a possibility that cement prices would be higher than current levels. viability of undertaking large scale projects as well Furthermore, there is also the possibility of seeing as the impact on government expenditure must greater pricing variation between the different types of cement. However, it is clear from the above graph that cement imports enjoy an inbuilt cost advantage when compared with domestic cement manufactures. Therefore, while domestic manufacturers may have greater flexibility in terms of their pricing with the removal of the MRP, they may be constrained by the fact that if they revise their prices to a significantly higher amount, it may lead to a shift in demand towards imported cement; given that most household consumers perceive cement as a generic good. Hence, while there is the possibility of higher cement prices prevailing in the market, the scope for a significant price revision is constrained given this disparity in cost between domestic manufacturers and cement importers. Cement imports – Higher Following on from the previous point, assuming that the potential for a cement price increase is less significant, it follows that it is less likely that this alone would be sufficient to spur greater levels of domestic manufacturing of cement, given that other cost factors such as the high setup costs, and geographical restrictions remain significant. However, we do believe that the removal of the MRP would increase the scope for greater levels of cement imports, as supplying to the Sri Lankan market may as a result become more attractive. Construction Activity – Mixed A move to a more market-based pricing could result in an improved operating environment for construction firms and contractors, if this results in more gradual changes in cement prices in line with cost variations, as opposed to the sudden spikes that occur due to MRP price revisions. However, this consideration must also be balanced by the fact that higher cement prices impact a multitude of industries, including construction and other building material industries. Given that cement accounts for a large chunk of the input
cost of large scale infrastructure projects, the impact significant cost inflation would have on the
also be taken into account. Cement firm’s profitabilityPositive Given the strong underlying construction-related requirements for Sri Lanka as well as the limited substitutability of cement, we believe that both cement manufactures and cement importers are likely to see further improvements to profitability with the removal of the MRP. However, in a general equilibrium context, we are less certain of the desirability of this development. This is partly on account of the nature of the MRP regime for cement in Sri Lanka where the cost differential for cement manufacturers is reflected in the MRP. Hence the MRP regime in Sri Lanka is more akin to a pricing mechanism whereby a fair rate of return is given to the producer which is an efficient solution in the context of an oligopolistic market structure, as is the case with the cement industry in Sri Lanka. This aspect seems to be mirrored in the fact that while key input prices have witnessed significant fluctuations over time, cement firms have recorded more stable returns. Considering the performance of Tokyo Cement, this appears to be the case. Graph 13Cement firms manage to deliver an acceptable rate of return
Source: TKYO annual reports
Conclusions A more flexible MRP combined with strong quality assurance. Taking into account the unique characteristics of the cement industry in Sri Lanka and balancing it against the needs of the various stakeholders that are impacted by the existing pricing regime for cement -namely households, cement manufacturers, construction companies, and the statea certain degree of price controls is desirable. This is given the derived demand nature of cement, which is a key input for a product (the construction industry) which has a long gestation period where uncertainty is detrimental to the smooth functioning of the industry. In addition, the oligopolistic structure of the cement industry entails that some degree of state oversight on pricing maybe necessary to prevent market failure. Hence, price controls on a key product such as cement can bring about a greater degree of certainty to the entire construction related ecosystem. Having said that, our analysis of the 2011/122013 period underlies the fact that if price controls are too rigid, it can lead to negative outcomes such as shortages, hoarding, and entry of sub-standard products to the market. Hence, a more flexible system whereby in periods of high demand or high cost increases, if cement firms are granted the flexibility to respond more in line with market forces, it may lead to the creation of a more sustainable regulatory regime that is beneficial for all stakeholders concerned. Alongside this, a rigorous enforcement of quality standards on both domestically manufactured and imported cement, would be an essential factor in mitigating some of the negative factors associated with a price-controlled regime.
THE PHARMACEUTICAL SECTOR
Overview of the Pharmaceutical Industry Introduction The Healthcare and Pharmaceutical industry consists of 622 hospitals (as at 2014), and a large number of pharmaceutical importers and manufacturers. The Government of Sri Lanka is also heavily influential in the sector given the existence of universal healthcare and the State Pharmaceutical Corporation being a major player in the industry. The government has shown keen interest in the recent past to implement various regulations in the sector as well. In 2013 Sri Lanka had spent Rs.67.7 billion (US$524 million) on pharmaceuticals, and Rs.75.09 billion (US$570 million) in 2014. As for healthcare, in 2013 Sri Lanka had spent Rs.261.04 billion (US$2.02 billion), and the amount increased to Rs.283.97 billion (US$2.16 billion) in 2014. [Source: BMI] The global pharmaceutical industry is a US$1057 billion industry [Source: IMS Health Market Prognosis, May 2015], while the pharmaceutical industry in Sri Lanka is currently valued at around US$600 million. In Sri Lanka, the pharmaceutical industry is dominated by the State Pharmaceutical Corporation (approx. 40% market share), followed by the private sector. The industry is also heavily dependent on imports rather than locally manufactured pharmaceuticals, with only around 10-15% of pharmaceuticals being locally manufactured, while the remaining 85-90% are imports. With the rapidly aging populations and the increase in Non-Communicable Diseases (NCDs) in Sri Lanka, the health care sector (including pharmaceuticals) is expected to have a steady growth. Importing In the private sector, this segment is dominated by Hemas Pharmaceuticals (i.e. JL Morison Son & Jones (Ceylon) PLC), followed by Sunshine Holdings PLC, with many other players in the market such as Emerchemie NB Limited, CIC Pharmaceuticals, CiplaPharma, EmarPharma, Taprobane Pharmaceuticals, etc.
Local Manufacturers In the private sector, this segment is dominated by Hemas Pharmaceuticals (i.e JL Morison Son & Jones (Ceylon) PLC) being the largest manufacturer, alongside other players such as Astron Limited, Akbar Pharmaceuticals, Ceylinco Pharmaceuticals, Inter Pharm, etc. The pharmaceuticals that are manufactured domestically are predominantly generic drugs, as Sri Lankan pharmaceutical manufacturers do not focus on Research & Development and the making of original/innovative drugs. The drugs manufactured in Sri Lanka are also predominantly general Oral Solid Dosage (OSD) drugs. Industry Analysis Suppliers in the industry are relatively powerful in terms of bargaining power, since most suppliers are multinational organisations which supply across the globe and may view Sri Lanka as a very small market in the global context. While the existence of a large supply base from India would enable a larger source of suppliers, it will however be highly negative since the market will be exposed to cheaper drugs which may fail in quality. Consumers too will be relatively powerful in the industry with the range of generic drugs available for selection.However, consumer knowledge on pharmaceuticals is limited and is highly dependent on the advice by medical professions, which reduces the end consumers bargaining power. In the importing sector there is very low likelihood of new entrants since the current price controls seem to be quite difficult for importers to sustain their businesses.However, with the 2017 budget promoting the establishment of pharmaceutical manufacturers, the threat of existing pharmaceutical import companies moving into the manufacturing space, or even new companies entering the market, is moderately possible. Nonetheless,consumers will benefit from this large variety of generic drugs made available, and since the price controls have allowed for generic drugs and branded drugs to be priced similarly, it will allow consumers to make a switch between these two types of products relatively easily. In terms of competition, it will be relatively high between existing manufactures and importers given that consumers are likely to be more price sensitive in the context of stringent price controls imposed on generic and branded drugs.
an increase in price. The price of any other drugs
History of Price Controls beyond the 48 drugs cannot be changed as well. Previous Price Controls The 48 drugs currently under a price ceiling are The first ever attempt at controlling the prices of
mainly the drugs identified by Prof.Bibile, with a drugs was proposed by Professor Senaka Bibile in
few additions after taking into consideration new the 1970s, which was dismissed by the Sri Lankan inventions. government at the time as it was perceived as It is also expected that a similar second phase being impossible and did not suit Sri Lanka’s of price ceilings will be implemented in the open economy. The World Health Organization near future on expensive drugs for treating eventually endorsed Professor Bibile’s policy by the tumours, benign lumps, and cancers. The 1980s. current price ceiling on 48 drugs is expected to The creation of a national drug policy resurfaced
be fully implemented in 45 weeks from initial but failed in 1991 and 1996. In 1996, the president implementation, after which the second phase will at the time, President Chandrika Kumaratunga,
then be implemented. initiated the establishment of a national drug Sector Analysis policy but failed to receive cabinet approval. In Overall Industry
2005, the government established the National Medicinal Drugs Policy (NMPD) to ensure the The Health Ministry implemented the aboveavailability and affordability of drugs,andeventually mentioned price controls in the hopes of reducing received cabinet approval. However, it was never imports and encouraging local manufacturing. implemented until the recent steps taken by the This is not entirely evident with the value of current government, and the establishment of the imports rising through Oct-16 and Nov-16, but National Medicines Regulatory Authority (NMRA). shows in the sharp decline during the month of Dec-16 (Graph 1). However, it is too early to
There was however a price regulation in the last expect full impact by Dec-16, hence the Mar-17
few years, which was in essence a “price freeze.” quarter is likely to give a better picture of the
This regulation ensured that pharmaceutical impact of price controls.
companies could not change the price of a drug after it had been set and required special consent Over the years however (until 2015), there from the relevant authorities if a price increase was a noticeable decline in the volume of was needed. pharmaceuticals imported while the value of imports continued to increase;an indication of the
Current Price Controls sensitivity of the possible high pricing of drugs. On the 21 of October 2016, a gazette notification
st (Graph 2) was released by the Health Ministry -i.e. National Medicines Regulatory Authority (NMRA)- on
Graph 1 – Import values growth slows with setting a price ceiling on 48 drugs for common
imposition of price controls diseases such as diabetes, heart disease, high The government expenditure on healthcare blood pressure, high cholesterol, and others. According to the Health Minister RajithaSenaratne, this would result in an overall price reduction of around 40-50%, and a total cost reduction of around Rs.4000 million. (Source: Sunday Observer) The pricing mechanism takes into account the prices of any drug that commands a 2% or more market share (by volume), and then uses the median price as the MRP for that particular drug. The drugs which fall above the MRP are expected to be reduced to below the MRP, and any drug which is below the MRP is not permitted to have Source: CBSL Statistics has seen a steady rise over the years with the expenditure on health per capita at Rs.7497 in 2014, while 2015 had an overall expenditure of Rs.178 billion. The budget allocations for the year 2017 for health witnessed a decline from Rs.175 billion in 2016 to Rs.160 billion in 2017. The 2017 Budget also mentions the government’s strategy for the pharmaceutical industry, especially the local manufacturing sector. “To curtail draining out of foreign exchange from the country I invite private sector to venture into establishing Pharmaceutical Zones as PPPs. The government will also contribute by providing land. A buy-back arrangement will be agreed upon to purchase the government requirement of the respective pharmaceutical items manufactured and they will also be encouraged to access markets on their own”
Graph 2– Clear divergence in the volumes vs value of imports
Source: CBSL Social Statistics report Pharmaceutical Companies and Hospitals According to the Central Bank of Sri Lanka as at 2015, the capacity utilisation in pharmaceutical factories is at 91%, while the State Pharmaceutical Corporation (SPC) has the capacity to produce 1,900 million capsules and tablets. However, the SPC achieved a production of 2,026 million capsules and tablets of which 2,054 million were sold.
The financial performance of the healthcare segments of Sunshine Holdings, CIC holding and JL Morisson were analysed, and the performances were mixed, with Sunshine experiencing a sharp decline in profits (loss making) while CIC and JL Morisson witnessed continued steady profits during the Dec-16 quarter. Operating profit margins declined sharply for Sunshine while JL Morisson continued to maintain a steady margin (Graph 3). This mismatch in performance can be attributed to the fact that sunshine is solely an importer, while CIC and JL Morisson have manufacturing facilities as well. Graph 3– Divergence in performance reflects differences in business activity
Source: JLM and SUN annual reports financials The hospitals on the other hand did not experience any major changes in margins, except for Lanka hospitals, which experienced a major drop in gross profit margin during the Dec-16 quarter (Sept16: 59.9% and Dec-16: 49.7%), but no significant changes in operating profit margins and overall profitability. (Graph 4) Graph 4 – No visible impact on the performance of Hospitals
Source: Hospital annual reports
As seen in Table 1 there has been a relatively high impact on the prices of certain drugs for certain companies. With some companies and drugs requiring price changes of up to 85% in certain drug prices. Table 1 – Firm’s across the board impacted by price controls*
Hemas Sunshine Emerchemie PharmaHealthcare NB (Ceylon) ceuticals Lanka LtdLtd (Pvt.) Ltd Amlodipine 5 mg 4.59 15.07 13.08 Atorvastatin lOmg 3.11 20.82 21.1115.25 Atorvastatin 20mg 5.29 29.82 33.6422.03 Levofloxacin 250mg 26.45 20.53 Cefuroxime 250mg 49.45 69.98 35.85 Losartan K 50mg + HCT 12.59 19.99 21.72 12.5mg Combined Losartan Potassium 25 mg 2.3 11.11 10.16 Losartan Potassium 50 mg 3.97 16.62 6.4212.08 Metformin 500mg 2.3 5.66 3.75 Pantoprazole 20mg 13.8 22.17 15.4 Pantoprazole 40mg 23.46 31.63 24.315.02 RosuvastatinlOmg 36.92 39.8817.25 Cefuroxime 500mg 83.95 73.26 71.83 Ciprofloxacin 250mg 5.7 4.2 Clarithromycin 250mg 119.83 88.84 55.8221.85 Clarithromycin 500mg 219.65 133.86 79.3440.25 Levofloxacin 500ng 12.08 42.92 47.13 *The drugs highlighted in red indicate the drugs that needed to be revised to be compliant with the MRP Source: Pharmaceutical representatives
In 2014, a survey showed that 17.8% of the population of Sri Lanka suffer from chronic diseases, while 14.7% take treatment for acute diseases. The current price controls have been implemented mainly on drugs for chronic and acute diseases with the second phase of the price controls concentrating more towards drugs for chronic diseases. This is an indication of the demand that exists for the drugs, hence a downturn in pricing could result in a boost in volumes as predicted by the Ministry of Health when implementing these controls.
A George Akbar Baur& Maximum Steuart CIC PharmaRetail Price Co Health Holdings ceuticals (Pvt.) (MRP) (Pvt.) PLC (Pvt.) Ltd Ltd Ltd 1.21 10.44 16.33 15.3 14.92 8.11 11.15 25.28 2.6514.2 17.6 21.87 21.64 47.2 45.5 6.45 15.74 63.73 19.45 8.07 4.06 7.35 14.03 15.9365.55 10.3 2.3 3.28 6.9 3.95 3.45 23.87 24.87 31.83 10.3519.52 88.68 72.6 5.42 5.75 36.79 28.18 36.5 68.92 75.4 13.8 52.03 39.64 24.2
Industry Perspectives on Price Controls The perspective understood to be from individuals in the industry has been quite contrasting. The importers see the price control as mostly negative to the sector, whereas companies involved in manufacturing see many positives from the implementation of such controls. Positive views on price control Stakeholders on both sides of the isle have a pertinent point. The manufacturers expect that these controls will eliminate importers flooding the market with overpriced sub-par drugs, and the influencing of doctors to prescribe such drugs. The MRP is also expected to reduce anti-competitive practices of branded drugs, and if branded drugs perceive that Sri Lanka is an important market, then they should have lower prices since alternative generic drugs already exist in the market. They further went on to state that while they understand the need for originators/innovators at a higher price since there is a Research & Development (R&D) cost involved, they felt that most generic drugs were overpriced as well and reiterated the fact that the current 48 drugs under price control are all generic drugs. It was also mentioned that there is a misconception that locally manufactured drugs are of lower quality, and it was dismissed by the fact that there is more regulations and screening of raw materials and manufacturing plants. They claim that this leads to more consistency in the quality of locally manufactured drugs, unlike imported drugs which can vary from high to low quality and there is no proper screening done with regard to the quality of imported drugs. The development of local manufacturing will also create more jobs, while reducing the currency outflow since manufacturing requires the purchase of raw materials followed by a 20-80% value addition done locally. It will also enable local manufacturers to export and compete internationally especially in the Indian market.
There were also a few suggestions to improve the current price controls. One such suggestion has apparently already been communicated to the authorities. This involves the MRP of Paracetamol, which is below the cost of production. It was also suggested that drugs which are not older than 5-10 years should not have price control since innovators will need to cover R&D expenses and allow patents on such drugs. Another suggestion was the allowance of gradual price increases of around 10% on the price of a drug, provided that it is still below the ceiling price. Negative views on price control Stakeholders who import expressed the need for the market to decide the price, since individuals can purchase higher quality drugs at higher rates if they felt the need to do so, claiming that this isn’t a “control” as such but more of a price “reduction”. One of the major reasons for the negative view on the price controls is the depreciation of the Sri Lankan rupee against the US dollar which negatively impacts importers costs. Given that the exchange rate has been more volatile as of late, and with the inability to reflect this in the prices of the pharmaceuticals, many pharmaceutical importers will need to bear the losses made due to the depreciation in the exchange rate. Another issue mentioned was the fact that the change in regulations came overnight and this had apparently caused a lot of pharmaceutical stocks to be held in stores. A suggestion to avoid this would have been for the government to have granted a grace period so that such stocks could have been sold at usual rates to avoid heavy losses. The implementation of the ceiling price also has caused many pharmacies to return unsold stocks. A view expressed was that pharmaceutical companies will need to resort to cost cutting (like capital expenditure and costs related to training of staff). Currently it has only affected the hiring patterns of the relevant pharmaceutical companies, but it may lead to retrenching of staff and even the cessation of operations for certain smaller companies, especially those firms that are squeezed and volumes may be lower in rural areas. fully dependent on imports of pharmaceuticals.
This can lead to certain drugs only being available Accordingly, it is perceived that the second phase
in bigger cities and towns, and only in certain of price control will be too tough for the sector to
pharmacies. They also mentioned the threat to handle and could lead to the above outcomes.
the Sri Lankan economy of individuals travelling overseas in search of better medicines. [Source: Stakeholders in the industry mentioned that Economy Next] negotiations with suppliers have taken place and a few suppliers adjusted the prices of
The Ceylon Chamber of Commerce (CCC) also had imported drugs, but a few drug prices still remain
a view on the recent price controls. They believed below cost. However, the actual impact on
that the pricing mechanism is derived from the pharmaceutical companies will be visible with the
Indian model and is suitable for a large domestic March 2017 quarter results.
market with a substantial drug manufacturing base; which is not ideally suitable for Sri Lanka. Suggestions for improvements to the price They believe that the median price is derived from controls based on these views were the fixing a branded Indian generic which makes it unviable of exchange rates. One of the above-mentioned for originators, and that the current MRPs are individuals proposed alternate approaches to not a good reflection of quality and cost. The CCC achieve the aim of current price controls, such also mentioned that the ceiling prices in Sri Lanka as improvements in the customs in screening would be below the regional ceiling prices, and imported drugs to ensure quality standards, hence international brands are less incentivized improvements in the provision of universal to supply quality drugs to Sri Lanka. The threat healthcare with better procurement to ensure of good quality drugs not being supplied by drugs are available for the general public, better originators, and the presence of solely cheaper management of doctors and regulations on generic drugs was also mentioned. prescriptions, reduction in corruption, and more spending by the government on healthcare to
The CCC also suggested that the regulator around 3-5% of GDP (currently at around 1.5% of
consider an ‘automatic pass through’ for exchange GDP).
rate changes (movements up or down), which will ensure a revision of prices (quarterly), and which Views on public forums, reports and media would be linked to the Central Bank approved exchange rate. [Source: LBO] The Sri Lanka Chamber of the Pharmaceutical Industry (SLCPI) mentioned that the However, in a recent report from the CCC in pharmaceutical market in Sri Lanka is mainly March 2017, they expressed their appreciation import-based, and enjoys the opportunity of that the NMRA had used internationally accepted having access to high quality innovator products research derived from the WHO guidelines from different countries as well as generic on pharmaceutical pricing policies. They also drugs which are mostly imported from the Asian mentioned that there has been no evidence so far region. Hence, patients had the freedom to avail from the industry of any discontinuation of supply themselves of pharmaceutical products based of certain drugs due to the price control, and that on their needs. However, with the imposition of the benefit of availability and affordability of good the current price controls there is a danger of quality medicines outweighs the negatives. They innovator pharmaceutical and drug companies are also of the opinion that the industry and the exiting the market due to the inability to price private sector should conform and support the drugs as low as what is expected by the ceiling implementation of the NMRA initiatives. [Source: prices. They also mentioned the threat of the Ceylon Chamber of Commerce] closure of certain pharmacies around the country, especially in rural areas since margins will be
A recent BMI report on the Sri Lankan pharmaceutical industry mentioned this: “However, while imported medicine will continue to account for a large proportion of the total market, cost control measures targeting pharmaceutical spending, as well as low per capita drug spending, will keep a lid on the country’s attractiveness to pharmaceutical investors. This is illustrated by the likely introduction of additional drug price caps in the coming quarters, which pose downside risks to our forecasts.” [Source: Fast Market Research]
The health minister of Sri Lanka mentioned that the pharmaceutical industry recorded high sales after the execution of price controls, despite margins curtailed drastically. The pharmacies were able to sell more drugs than before he said, and patients who took drugs intermittently were now taking them regularly after price controls were imposed on a number of drugs. [Source: Ceylon today] Conclusions The impact of price controls and the viability of its implementation cannot be perceived as entirely beneficial or detrimental to the industry. This is evident by the mixed views relayed by stakeholders in the industry. A conclusion that can be arrived at present, is that the current price controls do not help importers. The main concerns regarding the current price controls is also the issue of the rupee depreciation over time, the inability to revise prices accordingly, and the possibility of originator/innovator drugs not being sold in Sri Lanka. The positives being the economic benefits of promoting local manufacturing, the expectation in the reduction of anti-competitive practices, and overall that consumers have better access to good quality drugs.
THE DAIRY SECTOR
producers or processors, and the retailers. A more
Overview of industry comprehensive breakdown of the several players The dairy industry has been a key focus in in this industry is provided in Figure 1. successive governments, with the key objective In terms of milk powder, Fonterra’s Anchor and
repeatedly highlighted being to achieve selfRatthi hold the largest market share -according
sufficiency in milk products. The target year for to market information-, followed by Nespray
the achievement of this objective appears to (by Nestle Lanka PLC), Lakspray (by Lanka Milk
be a moving target, with the most recent goal Foods (CWE) PLC) and Maliban (by Maliban Milk
being 2020. Despite this self-sufficiency goal, Product Pvt Ltd). Other domestic players include
local production meets below 40% of the total Pelwatte(by Pelwatte Dairy Industries Ltd) and
domestic milk requirement; considerably below Highland (by State-owned, Milco Pvt Ltd).
the 80% levels in the 1970s. Therefore, presently, the majority of the demand in milk products is met In terms of Fresh Milk, the key brands are Anchor, through imports, mostly from New Zealand and Kotmale (by Cargills (Ceylon) PLC),Ambewela (by Australia. In 2015, local milk production amounted Lanka Milk Foods PLC), Highland and Richlife (by to 374 million litres; a 12.1% increase from the Renuka group). previous year. In comparison, imports of milk and milk products grew by 21.5% over the year. Over The key players involved in milk collection and the last decade, in seven out of ten years, imports value addition to milk powder are Milco, Nestle, of milk powder have grown at a higher pace than Lanka Milk Foods, Cargills and Pelwatte. Other the growth in local production. players mentioned above are largely involved in packing and distribution of imported milk, For the purpose of this report we will focus largely although a select few also do engage in the on milk powder and fresh milk (liquid milk) as they production of fresh milk. stand to be the most exposed to the effects of price controls and regulations. Consumers in Sri Figure 1 – Flowchart of Milk Industry Lanka tend to prefer milk powder over liquid milk given its longer shelf life amid limited refrigeration facilities, itshigher perceived nutritional value, and greater availability to the masses. According to the most recent Household Income and Expenditure Survey conducted in 2012/13, the domestic household spent an average of Rs.1389 per month on milk and milk foods, which accounts for 8.9% of the total expenditure on food. Taking a closer look at milk Powder specifically, the household spent an average of Rs.1036 per month. Interestingly however, over time, despite the expenditure on milk powder rising at 11.8% annually (Compound Annual Growth Rate –CAGR) between the 2009/10 and 2012/13 survey periods, quantities consumed have reduced by 1.4% annually. This also holds true for the period between the 2006/07 and 2009/10 surveys. This indicates that while consumers spend more on milk powder, the quantity consumed is reducing. Market Players The dairy industry in Sri Lanka consists of multiple players along the supply chain. Broadly, the
Source: FAO industry consists of dairy farmers, milk collectors,
History of price controls Price controls in the dairy industry appear to be commonplace, with impacts being felt from the source to the end-consumer. Much of these regulated prices and their constant revisions are intended to encourage domestic production and meet its overall objective of self-sufficiency, as well as to shield consumers or producers from unfavourable movements in global Whole Milk Powder (WMP) prices. The most visible price control in this sector is the Maximum Retail Price (MRP) imposed on milk powder, declared an essential commodity in Section 18 of the Consumer Affairs Authority Act No.9 of 2003 [Source: Government Information Centre]. In addition to this, at the source, the farm gate price which is the price a farmer receives for supplying fresh milk, is also controlled by the government. Furthermore, the use of import duties and other taxes could also be considered forms of price controls in this industry. Maximum Retail Price (MRP) The MRP stands to be the most common form of price control instituted by governments. In Sri Lanka, both imported milk powder and locally produced milk powder are subject to an MRP. However, importers generally face a higher MRP than local producers, with the aim of making locally produced milk more competitive and affordable to consumers. Over the years, the MRP charged for importers and local produce has varied significantly, with revisions being seen almost annually. In 2010 and 2011, due to a significant increase in global WMP prices, the MRP of a 400g milk powder pack was raised by Rs.19 and Rs.20 each year respectively. Since then, the MRP of the 400g milk powder pack hit a high of Rs.386 in 2014, once again driven by a surge in international prices reaching up to US$5,000/MT. However, WMP prices have dropped, and have since then been hovering around US$2,000 to US$3,000 levels for the past two years; allowing the government to reduce prices. As at the time of writing, the MRP in Sri Lanka stands at Rs.325 and Rs.295 for imported and locally produced milk powder respectively; unrevised since the 2015 Budget. Similar price
revisions are also evident to 1kg milk powder packs. Graph 1 – MRP of 400g Milk Powder Pack
Source: Ministry of Finance, news articles Farm gate price While MRP is used to protect the interests of consumers and producers, the control of farm gate prices is largely aimed at encouraging domestic production and improving the quality of domestically produced milk. Since 2010, farm gate prices have doubled, rising to Rs.70 per litre in 2016 from Rs.34 per litre in 2010. In comparison, from 2010 to 2015, domestic production grew by 51%, corresponding to an annual growth of 8.6% (CAGR). While the repeated revisions to the farm gate prices support farmers, it increases the cost of production for processors. According to the FAO (Food and Agriculture Organisation of the United Nations), farm gate prices are largely determined by state-owned Milco’s costs and thus, is used as a tool for this state-owned enterprise to manage its costs. Graph 2 – Farm gate price
Source: Ministry of Finance
Graph 3 – Powdered Milk: Local Production vs.
Import duties and sensitivity to tax changes Imports In addition to the MRP and government-controlled farm gate prices, importers are further subject to adjustments in import duties. These tend to vary depending on the impacts of WMP prices on importers, or follows the fiscal policies of the present government. Most recently, in December 2016, it reduced the import duty by Rs.55, immediately after reducing it by Rs.35 in the November 2016 budget. The same budget also planned to tighten the belts of both importers and domestic producers, proposing to remove VAT exemptions on milk powder. Sector Analysis Local Production versus Imports
Graph 4: Domestic Production Gap vs. Total Domestic Requirement The dairy sector in Sri Lanka is dominated by imported products, with only a handful of domestic producers in comparison. It is not difficult to understand why being an importer of milk powder is more lucrative than producing locally. Firstly, given the shortage of milk produced domestically, with domestic production meeting only close to 40% of the total milk requirement, imports are a necessity and cannot be completely discouraged by the government. Additionally, importers purchase its raw material at international prices and can gain an advantage when these prices moderate, as it currently is.Conversely, they also incur higher costs when Production Gap = Total Milk Requirement – these prices rise. On the contrary, at certain Domestic Milk Production times, importers can face greater adversity than Domestic production to Total Requirement ratio
domestic producers, particularly through the gives the percentage of total demand which is met
unpredictable revisions of import duties, which by local production.[Source: Ministry of Finance]
negate any benefits from global prices. Input costs
Nevertheless, given the vast variance between the quantities of milk powder imported against While it is apparent that due to governmentdomestically produced milk powder, it could controlled farm gate prices domestic producers be argued that imports do not just meet the have no control over a significant portion of production gap but far surpass it. their raw material cost, whereas importers on the other hand are able to source from global markets essentially allowing them to manage their raw material costs, it could be argued that their exposure to movements in WMP prices could make their margins much more volatile than that of domestic producers.
Source: Department of Census and Statistics
However, through revisions of import duties and MRPs, the full effects of movements in global prices are not felt by importers. For instance, in periods where WMP prices surged such as in 2011 increase. This could be attributed to technological and 2013, the MRP of milk powder was increased to reflect this, however, the benefit of this was not fully passed on to importers as import duties were raised, exacerbating their difficulties. Local producers, on the other hand, were able to expand well as the private sector have supported these their margins further due to higher retail prices. As evident in Graph 4, these periods also helped to reduce the domestic production gap, as well with the domestic industry benefiting from a milk shortage. With WMP prices declining significantly since then, the MRP was also reduced. However, while importers are now exposed to considerably lower input prices, local producers are not compensated similarly with farm gate prices continuing to be increased. In fact, despite low WMP prices, duty waivers have been increased further to benefit importers. However, it is possible that the imposition of VAT on 1 November 2016 may have
st eroded this benefit. Graph 5 – Global Whole Milk Powder (WMP) prices
Source: Livestock Bulletin 2015(DAPH)
Yield of domestic production As mentioned previously, the control of farm gate prices is expected to encourage domestic milk production. In addition to this, a number of other factors also contribute to growth in local production of milk, including the number of milking cows and facilities and training provided to farmers to increase the yield from cows.
In the past three years, the numbers of milking cows have remained quite stagnant; however, over the same period milk production has continued to
advancements in breeds of milking animals, pasture developments, training and adoption of advance animal husbandry, management and milking techniques, etc. The government as
developments, with the government also engaging in importing cows over the past few years. Graph 6 – Cow milk production vs. Number of cows milking
Source: Department of Census and Statistics * Excluding Killinochchi and Mulativu Districts ** Excluding Kilinochchi District
Profitability of dairy producers/processors Milco (Pvt) Ltd. Milco is the primary dairy state-owned enterprise, in addition to the National Livestock Development Board (which engages in issuing quality breeding materials to farmers at reasonable prices, the establishment and maintenance of marketing outlets to supply quality farm products at reasonable prices, and the sale of fresh cow milk to the public). Milco is presently engaged in collecting, processing and distribution of milk in the country. Analysis of Milco’s financial performance indicates that despite revenues growing positively through most years, it still incurs operational losses consistently. These losses have largely been attributed to the increase in farm gate
Analysis of its financial performance indicated
prices, which resulted in rising direct expenses that it is strongly impacted by all forms of price
(particularly in FY2012 and FY2013) as well as controls, i.e. farm gate prices, MRPs, and import
capacity expansion activities (in FY2015). duties. Additionally, due to the import of milk On the other hand, the impacts of MRP revisions powder by the company it is highly exposed to have also been evident in their margins, changes in international prices. particularly in FY2014 where it attributed increase in profits to the upward revision of the retail price. In FY2013, the government increased the retail price of milk powder, resulting in lower consumer
Meanwhile, the moderation in revenue seen in spending on this commodity during the year. This
FY2015 is likely due to the steep reduction in the was also amid rising global prices and increased
selling price during the year. import duties faced by the company. Despite these Graph 7 –Milco (Pvt) Ltd : Revenue growth vs. unfavourable conditions, the company managed Profitability to grow its revenue through a brand re-positioning exercise of Lakspray,and was also able to post profits owing to forward booking of milk powder stocks. In FY2014, international market prices soared, however it was not reflected domestically as the Consumer Affairs Authority (CAA) did not revise its retail prices in a timely manner. This exerted pressure on the company’s margins, specifically on milk powder. Due to a shift in consumption patterns from milk powder to fresh milk, the liquid milk segment was however, able to improve its revenues despite poor margins. During FY2015, international milk powder prices began to decline. However, the local authorities immediately responded with increased duties on milk powder imports, while also reducing the MRP. This created a very unfavourable situation for the industry. During this period, the operating profit margins of the milk powder segment contracted to -1%. This was despite a revenue increase observed due to lower prices increasing consumption of milk powder. With the subsequent decline in global milk powder prices, the company was able to improve its Source: Ministry of Finance margins, both in powdered milk and liquid milk. However, the impact of the VAT could limit these Lanka Milk Foods (CWE) PLC benefits. Lanka Milk Foods (CWE) PLC packages and distributes imported whole milk powder and skim milk powderLakspray and Lakspraynonfat, while its subsidiary Lanka Dairies (Pvt) Ltd manufactures and distributes UHT treated fresh milk and nonfat milk under the brand name Ambewela.
Graphs 8, 9 – Performance of Powdered Milk
Industry perspectives on price controls Overall, most producers and retailers have made their displeasure with the use of price controls publicly known. A few of the insights gathered from annual reports as well as conversations with industry stakeholders gave further clarity to this notion. Fresh Milk producers “The successive increases in farm gate prices of fresh milk have made local dairy farmers uncompetitive against the cheaper imported milk powder. Milk powder is an essential nutrition component in the diet of a majority of Sri Lankans and the Company appreciates the necessity to maintain lower prices in view of health and nutrition-intake concerns. However, the context is counterproductive to the effective expansion of local dairy production due to the prohibitive pricing that stems from the high raw material and processing costs.”
- Cargills (Ceylon) PLC, Annual Report 2014/15 and
2015/16 Milk Powder importers “The year under review proved challenging for the milk powder sector, with the unprecedented hike in milk powder prices in the international market. No sooner the prices started decreasing in the international market, Graphs 10,11: Performance of Liquid Milk and the government authorities counteracted by increasing others the import duty Immediately. In addition to this, the Consumer Affairs Authority brought down the selling price of milk powder thus causing a very unfavourable situation to the industry.” -D H S Jayawardena, Chairman, Lanka Milk Foods (CWE) PLC, Annual Report 2014/15
“The shortage of high quality raw milk to meet the increasing liquid milk demand will continue to pose an obstacle to meeting the needs of the sector. Simultaneously, the increasing import duty on imported milk powder will continue to make milk powder a luxury and not a necessity, as should be the case for the citizens of the country. The maximum retail price imposed by the government authorities serves to have a detrimental effect on the selling price of the final product, thereby affecting the accessibility to a nutritious essential product such as milk” -D. S. C. Jayawardena, Director, Lanka Milk Foods (CWE) PLC, Annual Report 2014/15
Source: Company Annual Reports
“The profitability of the powdered milk arm suffered during the year due to the refusal by the Consumer Affairs Authority to allow companies engaged in the marketing and distribution of powdered milk to hike their prices in keeping with the global price rise in the rates of powdered milk. This ongoing and unfavourable status quo for the last two years is eroding the profitability of the powdered milk business in the country and gives rise to an urgent need for the renewed appraisal of price structures. We have made several recommendations to the appropriate authorities to consider the plight of powdered milk companies.” Responding to the effects of VAT hikes which “I am hopeful that the government authorities and the came into effect in November 2016, the Managing Consumer Affairs Authority will take a well-informed Director of Fonterra Brands for Sri Lanka and the decision to allow price increases in line with rising global prices of powdered milk in order to ensure a level Indian subcontinent,SunilSethi, expressed the playing field in the industry.” following sentiments at a forum: -D. S. C. Jayawardena, Director, Lanka Milk Foods (CWE) PLC, Annual Report 2013/14
Other milk powder importers also echoed this sentiment, noting that price advantages from global price movements did not have their desired impacts, as import duties are used to negate this benefit. Moves like this have even convinced some importers to stop imports and source milk locally, despite the plethora of problems in this segment Local Producers as well. Local producers are greatly affected by price Importers also expressed displeasure with the controls, both at source-as they purchase milk at fact that the maximum retail price for this product farm gate prices-, as well as at the point of sale, has remained unchanged for the past two years, with the MRP being fixed. This leaves them with despite several changes in both global as well as minimal control over costs and profits, dissuading domestic markets. The ad-hoc implementation them from local production while also constraining of VAT beginning in November 2016 was a further innovation; which is a vital factor if Sri Lanka is to blow to this industry. improve this industry. Further, given the almost Sector experts also pointed out the importance of annual increases of farm gate prices, farmers imports as it believed that self-sufficiency was not have no motive to improve productivity and will a realistically achievable target for Sri Lanka. Both continue to remain at present levels. given the shortage of milk production in Sri Lanka, Local producers further question the contradictory due to poor productivity, as well as constraining motives of the government which accommodates supply factors such as the limited landmass in the policies that allow imports to flood the market country, to meet the total demand requirements while holding onto objectives of self-sufficiency. (estimated to be between 80,000-85000 MT This excess supply created in the market through according to industry sources). imports suggests that prices should be lower, despite local producers being unable to sell at such prices.
“Sri Lanka plans to increase its domestic dairy production to 100% self-sufficiency by 2016. This is a challenging task, given the current state of the industry which merely supplies approximately 35% of the domestic requirements. Moreover, the limited landmass in Sri Lanka poses a Herculean challenge to make the country self-sufficient in liquid milk.” -D H S Jayawardena, Chairman, Lanka Milk Foods (CWE) PLC, Annual Report 2012/13
“It is not the way to go about it. We will be happy if we can source every drop of milk from this country. But currently we (local sourcing) can meet only 30 percent of the demand. But by curbing imports, we will run out of milk. Needed is an end-to-end solution to grow the local dairy industry[…]Like it or not, imports are here to stay. And we prefer if it stayed till we are able to develop our local dairy industry to fulfil our demand.” [Source: Daily Mirror]
Conclusions Examining the market factors and players, as well as by following careful analysis from views provided by varied stakeholders in the industry, it is evident that there is a disconnect with the aim of achieving self-sufficiency and the role of price controls, both at a retail level, with the use of MRPs, and at a farm gate level. The removal of the MRP would allow for a higher level of healthy competition among both importers and local dairy manufacturers, allowing market forces to decide prices. In terms of controlling farm gate prices, it is necessary that the government consider the needs of 20 million consumers above the 200,000 farmers who are the sole beneficiaries of this control. This would allow greater predictability and transparency of costs and revenues among industry players. It is also necessary for the government to recognise that given several supply constraints, the objective of self-sufficiency is not realistically attainable in a Sri Lankan context. Thus, authorities should recognise the importance of imports in meeting the growing demands of consumers and implement well-thought out measures to level the playing field between importers and domestic producers.
APPENDIX 1
Price controls in the dairy industry: Milking the consumer First published in the Echelon magazine, January 2018 by Ravi Ratnasabapathy The dairy industry has been promoted by the
Naturally this increases the cost of the final government with the objective of achieving self-
domestic products. sufficiency in milk products. The objective appears Between 2010 and 2016, farm-gate prices to be a moving target, the most recent year for doubled from Rs.34/litre to Rs.70/litre. achievement being set to 2020. Currently, local International prices of powdered milk halved production meets less than 40% of the total between 2014 and 2016, but Sri Lankan domestic milk requirement. consumers did not benefit as the controlled prices In 2015, local milk production amounted to 374
of imported powdered milk were only reduced by million litres, a 12.1% increase from the previous
16% from Rs.386/- to Rs.325/- for a 400g pack. year. In comparison, imports of milk and milk There is an inherent conflict between the products grew by 21.5%. Growth in imports of milk maximum retail price, designed to protect the powder outstripped growth in local production in interests of consumers, and the minimum farmseven of the last ten years. gate prices, aimed at encouraging domestic Unfortunately, policy towards the dairy industry is
production. a confused tangle of taxes and controls designed The contradiction between a floor price on liquid to achieve contradictory objectives. milk and a price ceiling on powdered milk means The bulk of the consumption takes the form of
that producers have an incentive to produce milk powder, most of which is imported. Local milk
items not subject to price control such as liquid is mainly used for value added products and only
milk, flavoured milk, butter, cheese, and yoghurt. surpluses are converted to milk powder.
However, as the input cost is high, they can only retail at high prices and are not competitive in The policy is complicated because there are comparison to imported products. two administered prices in the value chain: a maximum retail price on powdered milk, and
The government resolves this particular dilemma a guaranteed farm-gate price for liquid milk.
by imposing punitive taxes on imported dairy Influencing the value chain and adding complexity
products: Rs.880/kg on butter, Rs.625/kg on are taxes on imports of milk powder.
yoghurt, and around 140% on cheese. This raises the price of imports enabling local producers to Milk powder prices are politically sensitive. Policy compete, but as this has the effect of raising is primarily geared towards the goal of protecting overall prices, it is to the detriment of consumers. consumers, and interventions are made from time to time to set maximum retail prices. The farm-
In a further contradiction, the government also gate prices of milk are mandated to encourage
taxes the import of powdered milk, even while local production with the objective of achieving
it imposes a maximum selling price. The tax is self-sufficiency.
designed to earn revenue for the state. Importers of milk powder are squeezed between the tax Farm-gate prices of local milk tend to be high; (which raises costs) and the controlled price the cost of production of MILCO being the key (which sets a ceiling at which the product retails). determinant of price. According to the Food and Agriculture Organization (FAO):
The taxes change depending on the world market prices. In the past, when world market prices
“the farm-gate milk price is largely determined by the state-owned MILCO’s processing and marketing costs, both of which are reputed to be relatively high. The Government uses the farm-gate price as a political tool because it needs MILCO to cover its costs.The large private firms engaged in milk product manufacturing follow the purchasing prices offered by MILCO.” dropped, the tax rates were increased (while retail Although the good breeds in the upcountry have prices were unchanged) to earn revenue for the government. When world market prices increase, the importers lobby for revisions to the controlled price and the government responds either by raising the controlled price, or if a price increase is deemed to be politically unfeasible, reducing the tax temporarily. After a recent reduction, the current tax (approximately 28% of import price) is relatively low, but historically it was much higher; as much as Rs.350/kg in 2014. The ceiling on milk powder prices also creates problems for local liquid milk producers as they are unable to convert any surplus liquid milk to powder at a profit. The local dairy industry focuses on value added products due to better margins, but the market is too small to absorb the entirety of liquid milk produced. As excess milk cannot be stored for long in liquid form it must be either converted to powder or disposed. It appears that although the high taxes on value added products means that local production is encouraged, the resulting high consumer prices restrict the growth of consumption. Whenever a surplus of liquid milk is collected, producers face the dilemma of either destroying it or converting it to powder; both options resulting in a loss. The government is committed to raising domestic production and competitiveness, but structural impediments mean that the cost of local production is high. Prof. SivaliRanawana of the Faculty of Livestock, Fisheries & Nutrition at the Wayamba University of Sri Lanka, has identified some of the reasons for the low productivity, including lack of quality pasture/forage, small size farm holdings, and climate (which restricts the breeds that can be used). The best livestock-pure European breedscan only be maintained in the hill country, and even in that region there is a shortageof forage of adequate quality. The FAO notes that: “Animals are mostly fed on natural grasses available in common lands, such as roadsides, railway banks, fallow paddy fields, tank beds and other vacant lots, all maintained under rain-fed conditions.” the potential to yield 20 litres of milk per day -a level achieved on some intensive farms-, the average yield even in the best climatic conditions, is only half this level. According to the last comprehensive survey (conducted in 2008/2009) by the Department of Animal Production and Health, the average daily milk yields per cow were 10 litres in NuwaraEliya, 5 litres in Kandy, and 3 litres in Matale. Overall, Sri Lanka’s cows produce a woeful average of 2 litres of milk per day. Given the problems facing the domestic dairy industry, it is not surprising that the costs of production are high. Government intervention in the dairy market is an elaborate charade. Price ceilings on milk powder placate the public, even while the government contributes to raise costs by taxing the input. Minimum farm-gate prices please the dairyman, but squeeze value added producers who then need protection from imports. Consumers are the ultimate losers, facing limited choices and high prices.
APPENDIX 2
Do price controls on cement reduce construction priority has to be given to existing operators in the costs?
port. This limits new investment, competition and prevents prices from falling. First published in the Echelon magazine, January 2018 If the price controls were removed the price of cement would probably fall as it would give By Ravi Ratnasabapathy cheaper imports the opportunity to compete on price. Would this affect quality? Sri Lanka’s high construction costs: do price controls on cement help? Quality The President of Sri Lanka’s Chamber of The local cement industry has complained of low Construction Industry has complained that quality (and low cost) cement imports in the past. construction costs in Sri Lanka are higher than Low cost cement benefits consumers but if quality the region. Players in the tourism industry have is a concern this presents a problem. Unlike claimed that high construction costs inhibit in other products users cannot detect inferior capacity expansion in the tourism industry. quality. Substandard cement or construction work is a serious matter since the consequences may Why are construction costs so high? manifest after construction is completed. Cement makes up around 22% of total Sri Lanka’s standards on the quality of cement are construction cost. The Government imposes price good. Importers are required to submit samples controls on cement to keep costs low but is this for testing and on meeting the standard must be working? registered. Enforcement of the standard seems Price controls distort markets, causing shortages based on inspection of samples but this alone is and creating black markets but obvious market probably inadequate. There is a need to move to a distortions are not visible in cement. system that is self-enforcing. This may be because of industry involvement in This issue needs to be addressed through a setting prices which are based on cost estimates comprehensive building code, which is lacking. A provided by manufacturers. This seems likely, proper code is needed for consumer protection given that cement prices in Sri Lanka are higher and public safety. Although old regulations such than the region. as the Factories Ordinance exist these are not up to date and enforcement is weak. A Standard According the JUBM & Arcadis Construction Cost Code of Practice to regulate and enforce design, Handbook (2017) the cost of ordinary Portland construction and compliance requirements is cement in Malaysia is between RM19-20 per 50 necessary. kg bag which is about Rs.715-750/-. The cost in Indonesia is around Rs.845. The regulated price in While a uniform code is absent, a multiplicity Sri Lanka is Rs.870-930/- per bag. of approvals exist: at provincial, district, pradesheeyasabaha, urban and municipal Naturally, producers would be quite happy to level. These become even more complex when supply a product if the price were set high enough central agencies such as Urban Development and no shortages would occur. Authority (UDA), Sri Lanka Land Reclamation and Development Corporation and Department of
Promoting competition and allowing markets to Agrarian Development. This leads to overlaps of
work properly is best way to lower prices but in authority, conflicts of instructions, contradictory
2013 the Government imposed a new restriction regulations and compliance loopholes.
that curtails competition. The number of cement plants that may be operated in a port was limited There is a lot of red-tape but it does not improve to one per port. If a new factory is to be set up, safety or ensure quality.
The Government needs to replace these old regulations with a single comprehensive code, legally enforceable, covering all classes of buildings and including safety, structural stability and accessibility. Along with a code, building contractors and architects should be licensed and carry professional indemnity insurance. The objective of licensing is to ensure that work is done by people who are conversant with the standard (which should carry statutory force) and conduct their duties competently and professionally. In the event of any failure in buildings they may lose their license to practice. This is apart from any action taken in the courts. The insurance ensures that consumers can receive compensation for shoddy work. The code is selfenforcing; if there is a failure they will not be able to practice which gives the incentive to ensure quality. Specialist licenses should be necessary for more complex work, including: (a) Piling works (b) Ground support and stabilization works (c) Site investigation work (d) Structural steelwork (e) Pre-cast concrete work (f) In-situ post-tensioning work Overall construction costs Cement is only one part of construction cost, policy with regard to other construction materials significantly increases costs. The Government imposes high taxes on many imported construction materials to protect domestic industries. These include steel bars and rods (taxed at 89.66%), ceramic Tiles (taxed at 107.6%), sanitarywear (taxed at 72.4%). Aluminium extrusions, granite, electrical fittings, furniture and carpets are also heavily taxed. This results in high overall construction costs. For example, steel costs around USD 723mt in Sri Lanka but costs only USD500mt in Thailand and USD 470mt in China. The current (January 2018)
one month contract for LME Steel Rebar on the London Metal Exchange is USD 564/mt, the one year forward contract is USD 513/mt. By some estimates, the construction cost of an average (non luxury) high rise apartment block in Sri Lanka may be as much as 60% above Thailand or Malaysia, due to these protective taxes, despite Sri Lanka’s lower labour costs. The policy is a muddle of ad-hoc interventions. Contrast this with the UK Government, which in partnership with industry has developed a strategy to improve the performance of the construction sector by 2025. Objectives include lowering costs: a 33% reduction in the initial construction of new build and the whole-life costs of built assets, a 50% reduction in the overall time, from inception to completion of construction and a 50% reduction in greenhouse gases. The UK industry is focused on reducing costs through efficiency, better methodology, technology and innovation. The focus is on overall cost reduction not trying to protect local producers of construction material. Apart from protective taxes, the lack of scale amongst contractors, low labour productivity, outmoded methods and long delays in approvals also contribute to higher overall costs. Improvements in these areas will also reduce cost. According to the industry the bulk of the cement consumption is by households and private developers. Current policy raises, rather than lowers costs. High costs mean ordinary citizens are unable to afford housing while the Government intervenes to protect industry. According to a report by Jones Lang LaSalle
“high project development costs coupled with the high borrowing costs for housing loans have breached affordable limits and restricted the home buying prospects for Sri Lanka.
Based on our understanding from the affordability assessment, only the top-income-earning resident Sri Lankans can buy homes in Colombo. Residents with limited income are forced to opt for properties that are at least 20-25 km away from the city limits.”
Conclusion Price controls for cement are clearly not helping reduce construction costs. Restrictions on competition deter investment and contribute to raise, rather than lower cement prices. Other interventions, to protect local industry has resulted in raising overall construction costs. While the State is eager to intervene in unnecessary areas it has neglected its role as a regulator. Although in most circumstances the best protection is the common sense of an individual consumer, in instances where technical knowledge is needed to detect poor quality there is a case for regulation, particularly if public safety is involved. The Government should stop controlling the price of cement and focus on drawing up and enforcing a proper building code. To lower costs, the taxes on construction materials must be reduced and competition facilitated.