Research Publication
Perceptions on Current Issues Faced by the Public
Advocata | April 2019
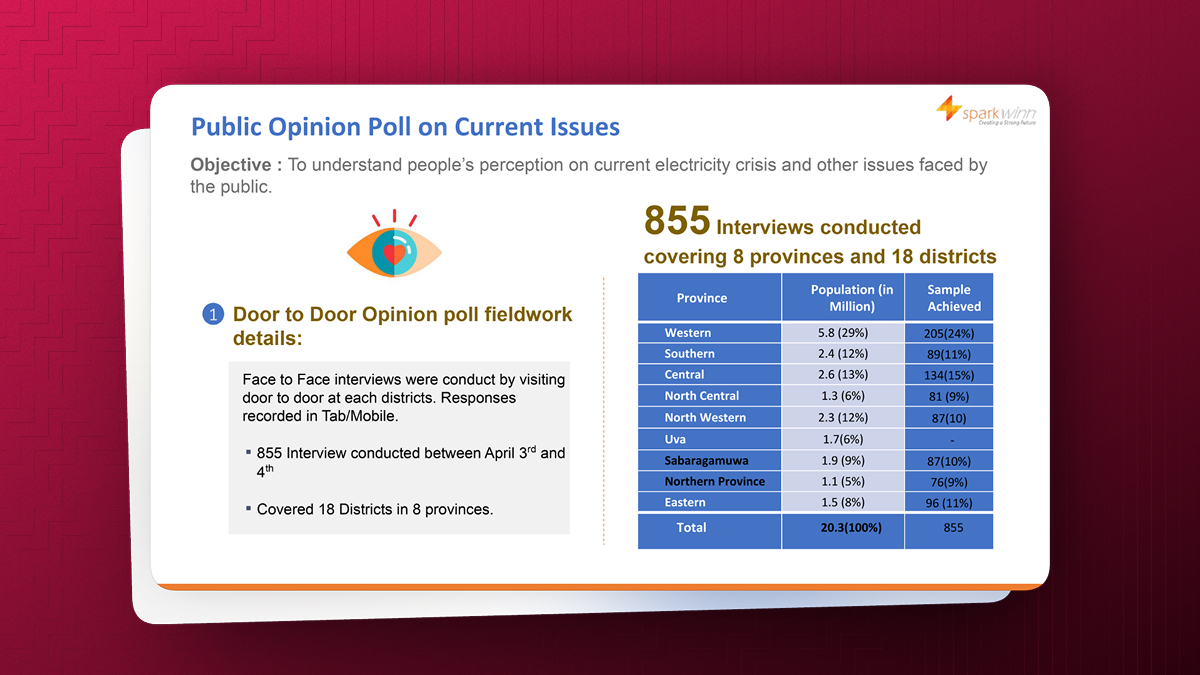
The poll was conducted to understand people’s perceptions of the current electricity crisis and other issues faced by the public.
Face-to-face interviews were conducted door-to-door, with responses recorded using tablets or mobile devices. A total of 855 interviews were conducted between the 3rd and 4th of April, covering 18 districts across 8 provinces.
| Measure | Result | Base |
|---|---|---|
| Losses of state-owned enterprises justified by services provided | Yes: 19% | No: 81% | 851 |
| Pay more for food to protect local industry | Yes: 43% | No: 57% | 853 |
| Pay more for construction material to protect local industry | Yes: 24% | No: 76% | 848 |
The poll used a door-to-door, face-to-face interview methodology. Respondents were interviewed within the selected districts and responses were recorded electronically.
| Item | Details |
|---|---|
| Fieldwork dates | 3–4 April |
| Interviews | 855 |
| Geographic coverage | 18 districts in 8 provinces |
| Interview mode | Face-to-face, door-to-door |
| Response capture | Tablet / mobile |
| Province | Population | Sample achieved |
|---|---|---|
| Western | 5.8 million (29%) | 205 (24%) |
| Southern | 2.4 million (12%) | 89 (11%) |
| Central | 2.6 million (13%) | 134 (15%) |
| North Central | 1.3 million (6%) | 81 (9%) |
| North Western | 2.3 million (12%) | 87 (10%) |
| Uva | 1.7 million (6%) | — |
| Sabaragamuwa | 1.9 million (9%) | 87 (10%) |
| Northern | 1.1 million (5%) | 76 (9%) |
| Eastern | 1.5 million (8%) | 96 (11%) |
| Total | 20.3 million (100%) | 855 |
| District | Sample achieved | Share |
|---|---|---|
| Colombo | 83 | 10% |
| Gampaha | 39 | 5% |
| Kalutara | 83 | 10% |
| Galle | 42 | 5% |
| Matara | 47 | 5% |
| Kandy | 46 | 5% |
| Matale | 44 | 5% |
| Nuwara Eliya | 44 | 5% |
| Kurunegala | 44 | 5% |
| Putlam | 43 | 5% |
| Anuradhapura | 40 | 5% |
| Polonnaruwa | 41 | 5% |
| Ratnapura | 15 | 2% |
| Kegalle | 72 | 8% |
| Ampara | 54 | 6% |
| Batticaloa | 42 | 5% |
| Vauniya | 29 | 3% |
| Total | 855 | 100% |
The source presents the demographic profile of the 855 respondents as follows.
| Profile | Category | Share |
|---|---|---|
| Gender | Male | 51% |
| Female | 49% | |
| Age | 18–25 years | 17% |
| 26–35 years | 33% | |
| 36–50 years | 28% | |
| More than 50 | 22% | |
| Education | Graduate / Professional | 13% |
| GCE A/L Level | 30% | |
| GCE O/L Level | 47% | |
| Grade 6–9 | 4% | |
| Up to Grade 5 | 6% | |
| Socio-economic class | SEC A | 16% |
| SEC B | 29% | |
| SEC C | 36% | |
| SEC D | 15% | |
| SEC E | 5% | |
| Monthly household income | Less than Rs. 30,000 | 27% |
| Rs. 30,001–70,000 | 62% | |
| Above Rs. 70,001 | 11% |
Base: All Respondents (855).
Question: Do you think the losses sustained by state-owned enterprises are justified given the services they provide?
Overall response: 19% said Yes, while 81% said No (base: 851 respondents).
| Demographic group | Yes | No | Base |
|---|---|---|---|
| Male | 17% | 83% | 427 |
| Female | 20% | 80% | 416 |
| 18–25 years | 18% | 82% | 144 |
| 26–35 years | 15% | 84% | 273 |
| 36–50 years | 17% | 82% | 234 |
| More than 50 | 23% | 76% | 159 |
| SEC A | 18% | 82% | 135 |
| SEC B | 22% | 77% | 244 |
| SEC C | 14% | 86% | 302 |
| SEC D | 21% | 79% | 125 |
| SEC E | 20% | 80% | 44 |
| Province | Yes | No | Base |
|---|---|---|---|
| Western | 12% | 88% | 204 |
| Southern | 6% | 94% | 88 |
| Central | 39% | 61% | 133 |
| North Western | 21% | 79% | 87 |
| North Central | 19% | 81% | 81 |
| Sabaragamuwa | 18% | 82% | 86 |
| Eastern | 18% | 82% | 96 |
| Northern | 22% | 78% | 76 |
Income group: Less than Rs. 30K — 17% Yes / 83% No (base 232); Rs. 30K–70K — 20% / 80% (base 524); Above Rs. 70K — 19% / 81% (base 80).
Question: Would you pay more for your food, if it means that the local industry is protected?
Overall response: 43% said Yes, while 57% said No (base: 853 respondents).
| Demographic group | Yes | No | Base |
|---|---|---|---|
| Male | 38% | 72% | 427 |
| Female | 48% | 52% | 418 |
| 18–25 years | 36% | 64% | 144 |
| 26–35 years | 42% | 58% | 273 |
| 36–50 years | 47% | 53% | 232 |
| More than 50 | 46% | 54% | 159 |
| SEC A | 51% | 49% | 135 |
| SEC B | 43% | 57% | 245 |
| SEC C | 38% | 61% | 303 |
| SEC D | 43% | 57% | 125 |
| SEC E | 45% | 55% | 44 |
| Province | Yes | No | Base |
|---|---|---|---|
| Western | 48% | 52% | 205 |
| Southern | 22% | 78% | 89 |
| Central | 43% | 57% | 133 |
| North Western | 24% | 76% | 87 |
| North Central | 64% | 36% | 81 |
| Sabaragamuwa | 61% | 39% | 87 |
| Eastern | 41% | 59% | 96 |
| Northern | 33% | 67% | 76 |
Income group: Less than Rs. 30K — 32% Yes / 68% No (base 232); Rs. 30K–70K — 48% / 52% (base 526); Above Rs. 70K — 45% / 55% (base 80).
Question: Would you pay more for construction material, if it means that the local industry is protected?
Overall response: 24% said Yes, while 76% said No (base: 848 respondents).
| Demographic group | Yes | No | Base |
|---|---|---|---|
| Male | 22% | 78% | 428 |
| Female | 26% | 74% | 414 |
| 18–25 years | 18% | 82% | 144 |
| 26–35 years | 24% | 78% | 272 |
| 36–50 years | 27% | 72% | 231 |
| More than 50 | 27% | 73% | 158 |
| SEC A | 25% | 75% | 136 |
| SEC B | 25% | 75% | 243 |
| SEC C | 21% | 79% | 301 |
| SEC D | 27% | 73% | 123 |
| SEC E | 34% | 66% | 44 |
| Province | Yes | No | Base |
|---|---|---|---|
| Western | 18% | 82% | 205 |
| Southern | 15% | 85% | 88 |
| Central | 27% | 73% | 133 |
| North Western | 7% | 93% | 85 |
| North Central | 45% | 55% | 81 |
| Sabaragamuwa | 49% | 51% | 86 |
| Eastern | 16% | 84% | 94 |
| Northern | 21% | 79% | 76 |
Income group: Less than Rs. 30K — 23% Yes / 77% No (base 233); Rs. 30K–70K — 25% / 75% (base 520); Above Rs. 70K — 21% / 79% (base 81).
The figures presented above reproduce the information available in the supplied source material. Bases vary slightly between questions (851, 853 and 848), so the question-specific base should be used when interpreting each result.
Percentages may not always sum to exactly 100% because of rounding or presentation conventions. No additional weighting, statistical testing, margin-of-error calculation, or inference has been added because those details are not provided in the source material.