 Video and Podcast
Improving Electricity Consumption based Targeting for Social Protection via the use of Composite Variables
3, March 2025
12 min read
Thashikala Mendis, Charith Peris*
*This work does not relate to author’s position at Amazon
Abstract
Using electricity consumption to determine eligibility for welfare benefits in Sri Lanka, has been shown to greatly improve the current reach by leading welfare programs. This study identifies several variables that, in combination with electricity consumption, can be used to further improve the efficiency of targeting the right population for social protection. Coverage improvements in the 5 lowest income deciles of up to 8.3% and 2.3% are found by using household expenditure and household food expenditure in combination with electricity consumption as opposed to using the latter by itself.
1. Introduction
The current Sri Lanka economic crisis is the worst seen by the island since its independence in 1948. Ineffective governance exacerbated by the COVID-19 pandemic has led to unprecedented levels of inflation, sharp increase in prices of basic commodities and significant shortages of food and medical supplies. According to the Department of Census and Statistics, the national poverty line in Sri Lanka reached Rs. 13,777 in December 2022, making it increasingly challenging for individuals to meet their daily expenses.
A study conducted by (Lirneasia 2023) revealed that 31% of the population (corresponding to 2 million households and 7 million individuals) is living in poverty. Household food consumption has reduced with up to 47% having to limit meal portion sizes, 33% eating fewer meals a day, and 27% having to restrict adult food consumption to ensure that their children have enough to eat. Households have had to resort to selling their household assets and digging into their savings to meet their day-to-day needs. Education has been adversely affected, with up to 6% of households that include children aged 5-18, being unable to send at least one child to school. In light of this situation, it is crucial for Sri Lanka to set up efficient social welfare programmes for disadvantaged individuals and families and provide them with the necessary support.
Set up in 1995, the Samurdhi welfare program was introduced by the Sri Lankan government with the objective of reducing the vulnerable population in the country through the dissemination of funds. However, it is widely acknowledged that the effectiveness of the scheme is questionable (Centre for public impact 2017). Out of the approximately 1.7 million families receiving monthly Samurdhi cash transfers, only 40% were found to classify as poor (Lirneasia 2023). Moreover, Samurdhi benefits reached only 31% of the poorest decile of households, while also reaching up to 4% of the richest decile of households. Issues related to its mechanisms, administration cost, politicization influenced by lobbying groups are major causes of ineffectiveness of the Samurdhi programme (Centre for public impact 2017).
Recently, the Sri Lankan government replaced the existing Samurdhi scheme with a new program called “Aswasuma.” However, issues similar to those that plagued Samurdhi have been identified to affect this new program (Tennekoon 2023). Therefore, there is a significant need for new schemes with effective targeting in order to efficiently target the relevant population in poverty for social protection.
2. Electricity consumption as an eligibility criteria for social protection
Using electricity consumption as a means of improved targeting for social protection has been discussed in multiple studies (Ranasinghe 2011, Moore 2022). (Moore 2022), emphasized the importance of establishing a new registry of eligible households to effectively implement a direct cash transfer system, as part of the IMF agreement focused on protecting the poorer segment in the society. They pointed out that the household electricity bills could provide reliable, verifiable, accessible, and up to date information in real time. The pros of using electricity as an indicator are that nearly 99% of households receive electricity directly from the Central Electricity Board (CEB), while the few remaining households not connected to the CEB are mainly in remote areas. This means people in remote areas will automatically be identified as eligible households. Additionally, since all household billing is digital, accessing billing histories is easy.
In addition, in 2022, the Ceylon Electricity Board reported a consumer increase of 54.8% compared to 2010 indicating a substantial growth in the total number of electricity consumers over time period. This suggests a continued ability to use electricity consumption as a means of targeting lower income populations for social protection.
Verite Research conducted a study on the Household Income and Expenditure Survey (HIES) 2016 (Gunewardena and Siyambalapitiya 2023) and found electricity consumption to be a superior indicator for successful targeting of people in poverty. According to their findings, 99% of households in Sri Lanka are connected to the national grid. 48% of the population resides in households that consume 60 kWh or less of electricity per month. They find that using a threshold of 60 kWh per month as a preliminary eligibility criteria will reach approximately 50% of the population and over 80% of the poorest among them.
3. Choosing composite variables for coverage improvement
Electricity consumption continues to be an important variable in the measurement of poverty (see Appendix A for an analysis based on the HIES 2019 data). However, there are other variables that, in combination with electricity consumption, can yield improved targeting of lower income populations.
The Welfare Benefits Act, No. 24 of 2002, introduced a methodology for identifying low-income families for welfare benefit payments that comprised six criteria, with each criterion assessed using specific indicators. The methodology described several variables related to education, health, economic status, housing, and family demography. These variables can be computed using the HIES data. In this study, a subset of these variables is chosen based on their correlation with household income (see Appendix B). Their impact on improving coverage of the population within the lowest income deciles are explored.
1. The Gazette of the Democratic Socialist Republic of Sri Lanka, Welfare Benefits Act, No. 24 of 2002. Source
In 1964, Mollie Orshansky developed a set of thresholds as a way to measure income inadequacy in the United States. Orshansky’s poverty thresholds were derived using the cost of a minimum food diet and were used extensively for estimating the number of people living in poverty in the United States. This study draws inspiration from this work and explores the use of food expenditure from HIES in improving the coverage of the population with lowest income.
4.Improvements in targeting
This study, based on the most recent HIES 2019 data, proposes using a subset of variables proposed by the Welfare Benefits Act, No. 24 of 2002 in combination with electricity consumption to improve the coverage of low income population when targeting for social protection. A correlation analysis on all variables defined in the Welfare Benefits Act showed that three variables show positive correlation with household income and are therefore of interest. They are as follows. Note that we include the optimum threshold we recommend for variables that are non-binary,
- Household expenditure [Rs. 30,000]
- Household food expenditure [Rs. 10,000]
- Household mobility assets
For each variable, we use a threshold that is calculated based on the median value.
Figure 1 and 2 show the coverage improvement provided by the usage of proposed composite variables. As expected, household expenditure provides an easy means to improve the targeting of the lowest income population. We see that utilizing a household expenditure of less than Rs. 30,000 together with electricity consumption of < 60 kWh, increases the coverage across the 5 lower income deciles by 8.3% with only a 1% increase in the 5 higher income deciles.
1The Gazette of the Democratic Socialist Republic of Sri Lanka, WELFARE BENEFITS ACT, No. 24 OF 2002
documents.gov.lk/
When considering a composite of electricity consumption (< 60 kWh) and food consumption, the coverage across the 5 lower income deciles increases by 2.3% with only a 0.7% increase in the 5 higher income deciles. The coverage of the lowest income decile increases by 3.4%, resulting in improved ability to target the lowest income population for assistance.
In the case of electricity consumption coupled with household mobility assets, while targeting improvements of ~18% are seen across the 5 lower income deciles, a high trade-off of an increase of ~15% in the 5 higher income deciles is also observed. Deeper analysis is required to identify if this composite variable provides a practical cost-benefit, and whether it can be further coupled with other variables to improve reach.
Conclusion
This study explores composite variables and their impact on coverage improvement of lower incomes populations. We provide evidence that these composite variables provide notable improvements in targeting over the use of electricity consumption alone, while significantly improving coverage by pre-existing programs like Samurdhi.
There are several benefits to the use of electricity consumption as a measure of eligibility for social protection. These are described by (Gunewardena and Siyambalapitiya) as the ease of implementation, ease of adjustment of eligibility and the elimination of politicisation and corruption. While the composite variables proposed here would likely require additional effort to measure, they provide much needed improvement in coverage while maintaining ease of adjustment of eligibility and reduction in politicization and corruption. Therefore, it is recommended that the Government of Sri Lanka look into the proposed composite variables as a means of improving targeting for social protection.
Why should the government of Sri Lanka use composite variables over the use of electricity consumption alone? The main reason is that improvement in coverage is critical for the welfare of people in need. Every percent improvement adds to the number of households that obtain much needed assistance. A cost benefit analysis of this will be conducted as part of future work.
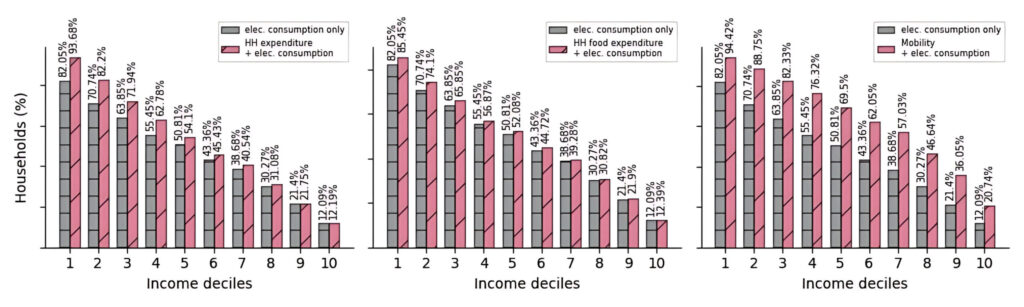
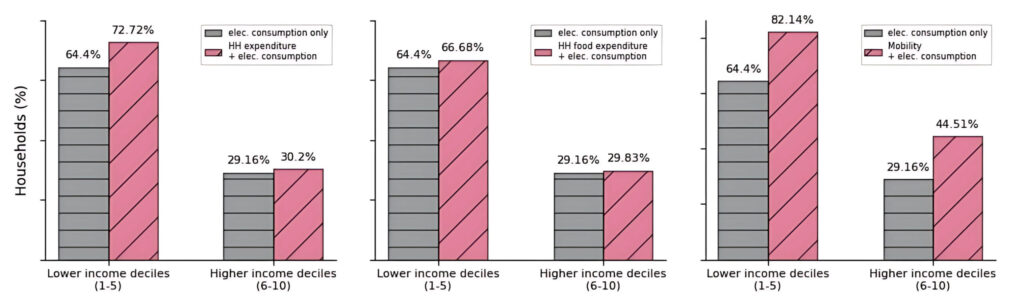
Figure 2: The bar charts compare the percentage of household coverage within the lower income deciles (decile 1 to decile 5) to those of the higher income deciles (decile 6 to decile 10) when considering a given variable or composite variable with associated thresholds. As in Figure 1, the household percentage covered by a composite variable (diagonal lines) is compared against a baseline comprising the household percentage covered by using only electricity consumption < 60 kWh (horizontal lines).
Appendix A: Establishing HIES 2019 electricity consumption as an indicator of poverty
For the 2019 HIES dataset, according to the Figure A, it can be observed that 82% of the lowestincome decile (poorest 10% of households) consume less than 60kWh of electricity. This supports the observations by the Verite study in the 2016 HIES data and further corroborates that electricity consumption is a strong indicator of poverty. Similarly, in the second decile, 71% of households consume less than 60kWh. These statistics indicate a decreasing trend in consumption below 60kWh across the income deciles. In the highest-income decile (richest 10% of households), only 12% of households consume less than 60kWh.
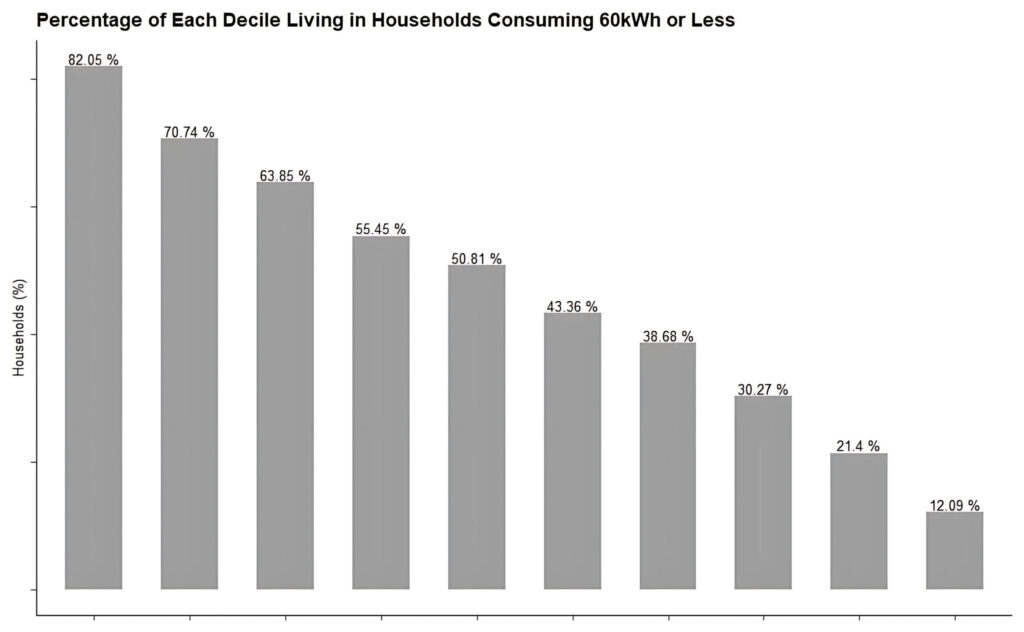
Figure A : Persons living in Households consuming 60 kwh or less
Appendix B: Correlation study
In order to pick our variables of choice we observed the relationship between household income and all the variables provided in the above welfare benefit act.
To facilitate the analysis, some of the variables in the welfare act were converted into numerical values, and new variables were analyzed. There are a total of 10 numerical variables, including the number of family members who have completed at least O/L education, the number of school-age children (5-16) not enrolled in school, the number of family members with diseases, the number of family members with disabilities, household expenditure, household food expenditure, household expenditure, the number of owned occupied houses or land, the number of other owned houses and buildings, the number of owned highlands, and the number of owned paddy fields and dependency ratio. Additionally, there are 12 categorical variables.
Based on the main objective of predicting the income level of a particular household, correlations with all the above variables were checked. For all the numerical variables, Pearson correlation was applied, while for the categorical variables, point-biserial correlation was used.
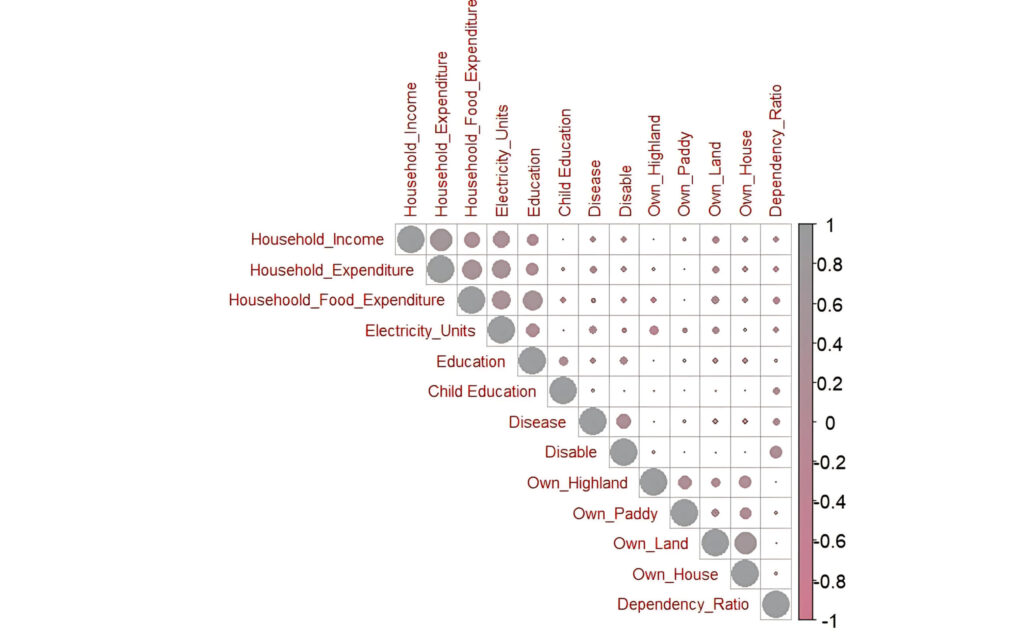
According to the above figure, it can be seen that the household expenditure, household food expenditure, education level of family members, and not having at least one asset related to mobility have positive correlation with household income.
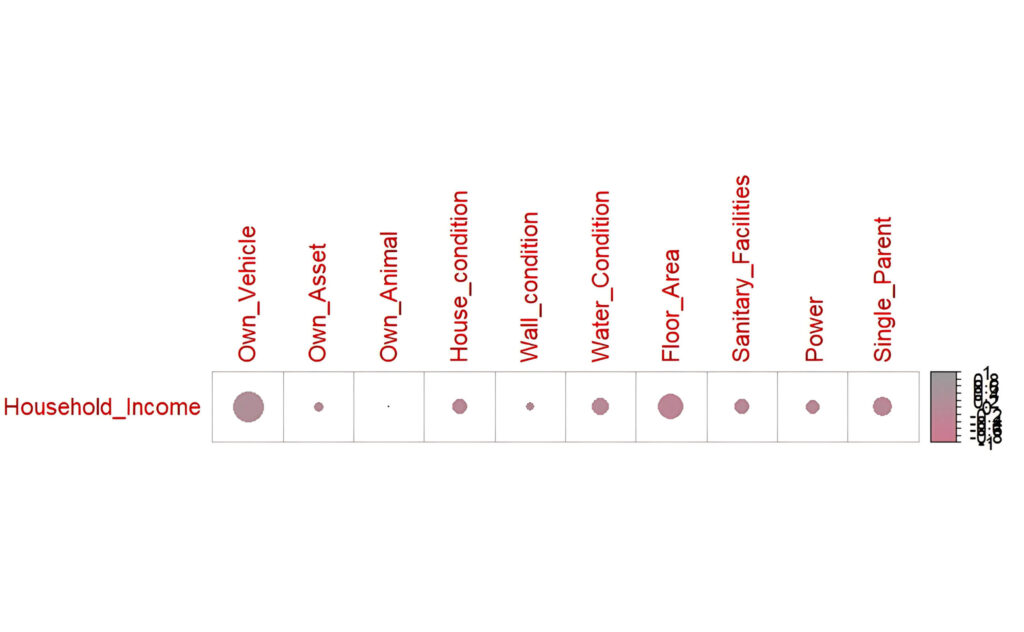
The above figure indicates that having at least one asset related to mobility has a positive correlation with household income.
First, the analysis focused on household income along with the correlated variables. The primary objective of this analysis is to identify a variable that, when combined with electric consumption, has the potential to increase the coverage of lower-income households while having minimal impact on higher-income households. To determine the threshold at which the percentage would increase, the median value was utilized due to the positive skewness and asymmetric patterns in the variable distributions. The median, which represents the middle value in a dataset, was chosen as the threshold. By utilizing the median as the threshold, it was aimed to identify a variable that, when combined with electric consumption, would surpass this threshold and consequently contribute to a substantial increase in coverage for lower income households. The median is then adjusted to determine the optimal threshold.
References
- Centre for public impact. 2017. “The Samurdhi Programme in Sri Lanka | Centre For Public Impact (CPI).”
Centre for Public Impact. Source
https://www.centreforpublicimpact.org/case-study/samurdhi-programme-sri-lanka. - Deyshappriya, Ravindra. 2023. “Economic Crisis, Inflation and Poverty in Sri Lanka.” LSE Blogs.
Source – https://blogs.lse.ac.uk/southasia/2023/01/02/economic-crisis-inflation-and-poverty-in-sri-lanka/. - Gunewardena, D., and S. Siyambalapitiya. 2023. “Electricity Usage as a Proxy Indicator for Poverty Targeting.” Sri Lanka Journal of Economic Research 10 (2): 115. Source – https://doi.org/10.4038/sljer.v10i2.186.
- Lirneasia. 2023. “Social Safety Nets and the State of Poverty in Sri Lanka.”
Source – https://lirneasia.net/wp-content/uploads/2023/06/LIRNEasia-Social-Safety-Nets-and-the State-of-Poverty-in-Sri-Lanka-3.pdf. - Moore, Mick. 2022. “Electricity and eligibility: Targeting cash transfers in Sri Lanka.” Institute of Development Studies. Source
- Ranasinghe, Athula. 2011. “Study on Requirements of Prospective Electricity Consumers and Fuel (electricity) Poverty & Affordability.” PUCSL.
Source – https://www.pucsl.gov.lk/wp-content/uploads/2020/06/2011-fuel_poverty_affordability_april_2011.pdf. - Tennekoon, Sahan. 2023. “Aswesuma controversy: ‘Don’t become victims of political agendas.’” The Morning.Lk, July 26, 2023.
Source – https://www.themorning.lk/articles/w026q85Sj8FB8H6od903.