Video and Podcast
SATHYA KARUNARATNE AND ANEETHA WARUSAVITARANA
Urban living offers many benefits to residents, better job opportunities, and higher incomes but the rapid and unplanned urbanisation experienced in Sri Lanka brings challenges including pollution, congestion, social issues and pressure on housing markets.
One of the consequences of the growing popularity of cities is a strong increase in demand for housing but the supply of land in towns is limited which results in rapid increases in land prices. While high land prices are a part of the problem, the high cost of construction materials adds to this, presenting a huge obstacle to affordable housing. A testament to the problem is that ever increasing numbers are forced to seek work overseas in order to afford a house.3
In the absence of affordable housing, many urban dwellers are forced into low quality, overcrowded housing which have poor water supply, sanitation, drainage and solid waste collection. Some may be in temporary settlements and run the risk of eviction, while others may be at risk due to unsafe locations. These issues are referred to as urban poverty but to address this requires a proper understanding of the scale of the problem.
While there is little doubt that Sri Lanka is urbanising rapidly, official statistics under-report the extent of urbanisation. The Department of Census and Statistics classifies 18.2% of the population as urban but changes in the definition of urban areas means this number is very wide of the mark.
The introduction of Provincial Councils in 1987 saw a reclassification with some areas that were previously classified as urban being reclassified as non-urban. This resulted in a sharp drop in the area reported as urban. In 1981, 21.5% of the country was classified as urban but this dropped to 14.6% in 2001, despite steady economic growth. The Agglomeration Index offers an alternative measure of urbanisation. A “large” city here is defined as one comprising 50,000 people or more. In these terms, 44.1% of Sri Lanka’s population is urban. If the definition is widened to 100,000 people or more 33.7% of the population qualifies as urban.4
High levels of urbanisation are linked to the proliferation of underserved settlements. Colombo has seen rapid urban expansion, subsequent population growth and an increase in underserved settlements. A survey carried out jointly by Sevanatha Urban Resource Centre and the Colombo Municipal Council (CMC) in 2012 records an increase in the number of informal settlements from 1614 to 1735, over a period of 10 years.5 The World Bank states that the Colombo Metropolitan Region (CMR) has seen its population climb from 3.9 million in 1981 to 5.8 million in 2012. The CMR accounts for only 6% of the total landmass of the country so 28% of the
population is competing for space in 6% of the landmass.6
One may question as to why such a large proportion of Sri Lanka’s families have been compelled to compromise on acceptable living conditions and shelter. High tariffs imposed on construction material that drive up their prices are a part of the problem. As a result, the average domestic consumer is placed in a position of difficulty, while the domestic producer benefits vastly from the high tariff regime in place. The high prices of imported construction goods and materials contribute towards creating a captive market to the benefit of the domestic producer. The price taking consumer is now faced with a dilemma of choosing between costly imported
construction material and price inflated local goods.
The Housing Needs Assessment and Data Survey of 2016 outlines that of six million families living in Sri Lanka only 5.2 million have some form of housing. Moreover, the report states that Jaffna (12,952), Batticaloa (12,482) and Colombo (80,615) districts have the highest number of total temporary houses by the district. Kandy (29,471), Gampaha (33,025), and Colombo (33,147) report the highest number of total partly constructed houses by the district.7
Sri Lanka’s construction costs average LKR 4,500 per square foot at present.8 Houses ranging from 1000 to 2000 square feet are the most popular.9 Thus the average house would cost between Rs. 4,500,000.00 to Rs.9,000,000.00. The study states that the lowest demand was for a floor area of 500 sq. ft.10 This means that one would now have to incur a cost of Rs. 2,250,000.00 for the construction of a “basic house” that would be “affordable”
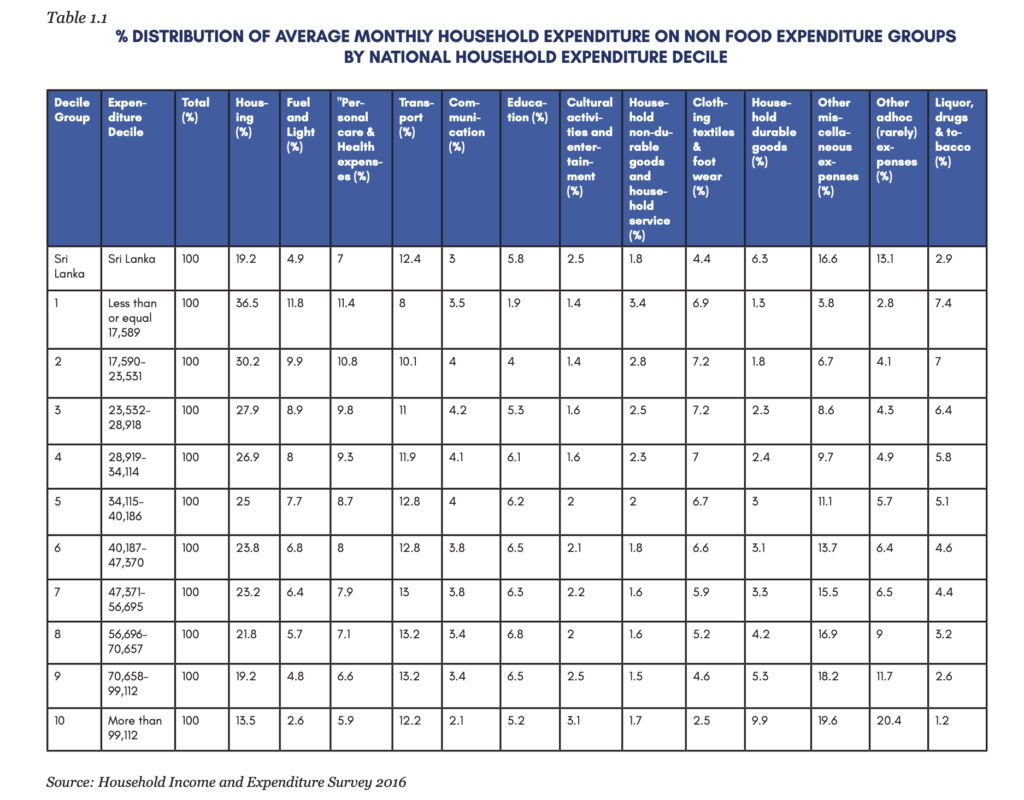
Sri Lanka’s per capita income for the year 2019 as reported by the Ministry of Finance is Rs.688,719.11 This amounts to a monthly per capita income of Rs 57,393.25. As per the household income and expenditure survey, the expenditure decile that falls under the category of having an expenditure capacity of Rs. 56,696 – Rs.70,657, spends 21.8% of their income on housing and is only left with 6.8% to be spent on education, 7.1% on healthcare and 5.2% on clothing and footwear.12 In light of this, it is evident that Sri Lankan households are deeply financially stretched by high housing costs.
Table 1.1 below explains Sri Lanka’s average monthly household expenditure on major non-food expenditure groups by national household expenditure decile. The data presented in this graph highlights that the average monthly household expenditure on housing takes up a large proportion of a household’s income across most expenditure deciles.
Successive governments have identified the pressing need to address Sri Lanka’s housing problem in their national housing policies. Over the years governments have resorted to providing housing subsidies as a solution and imposing price controls on cement. While this may be a popular policy response, such ad-hoc solutions are not effective, especially when overall policy is incoherent: the tariff structure raises costs which offsets the benefit of any subsidies. The real solution lies in the government taking necessary steps to create a policy environment that is conducive for middle and low-income earners to construct their own house and to enable the housing market to function effectively. Ideally, housing policy would be less reliant on public subsidies and housing programmes that are often subject to change across governments and in some cases struggle to meet the requirements of the public. The alternative, where the construction of housing is affordable and accessible to individuals, would translate into housing needs being adequately met, and a lower burden on government coffers.
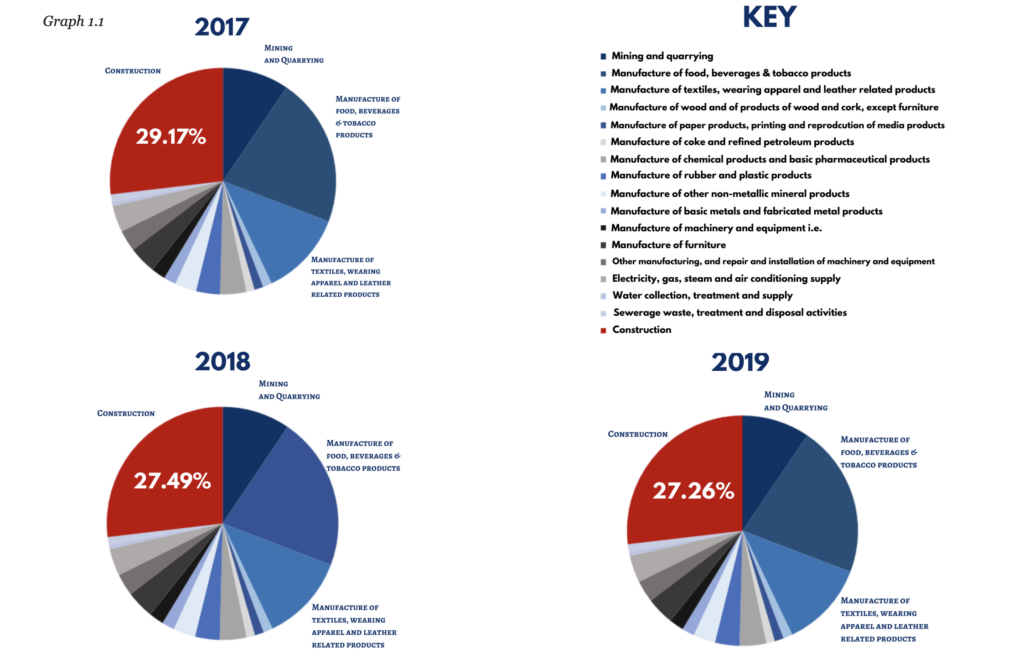
The charts below show the contribution by the construction industry to the industries sector in the years 2017,2018 and 2019.13
In 2019 tax revenue amounted to Rs 1,734,925 Mn, only 11.6% of GDP. Breaking this down further, the bulk of tax revenues are from indirect taxes, which accounted for 42% of total tax revenue in 2019.14
Indirect taxes impact both the domestic trade and imports but there has been steady growth in taxes on imports over the years. In 2000 they accounted for less than LKR 100 bn, and by 2019 this value had increased to just under LKR 800 Bn. Sri Lanka has had a history of over-reliance on import taxes for revenue, even before independence. In 1938 import duties accounted for 47% of government revenue, very similar to where we are at present.15
The breakdown of taxes on imports collected by the Department of Sri Lanka Customs is as follows:
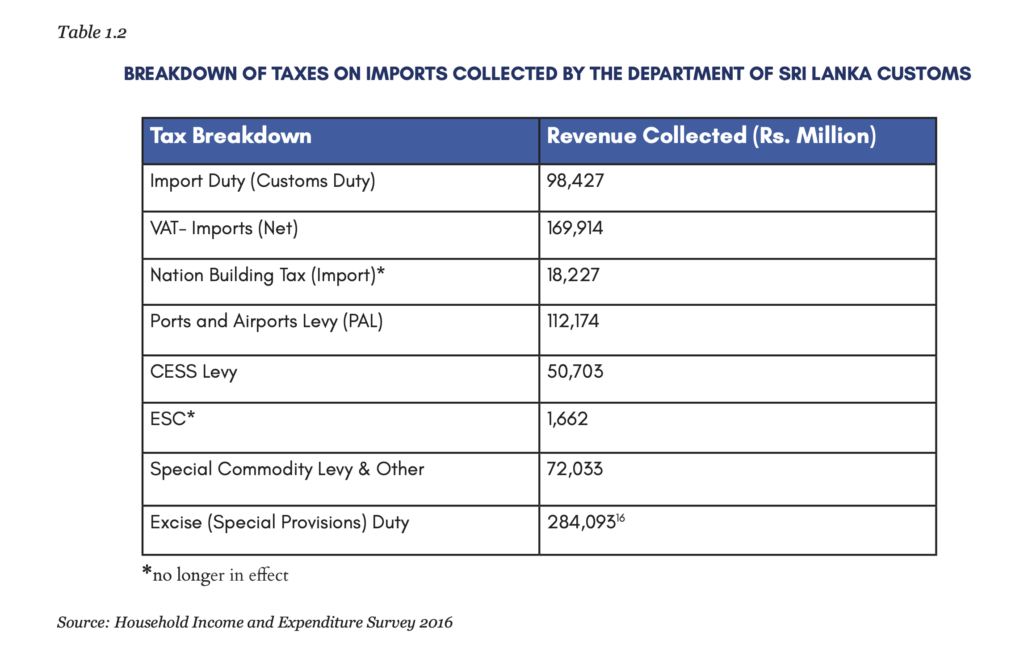
As is clear from Table 1.2 Taxes on imports are not simply one type of tax that is imposed on all imports. In Sri Lanka, we use ‘para-tariffs’ at the border: the Ports and Airports Levy (PAL), CESS Levy, the Nation Building Tax (NBT), the ESC, and the Special Commodity Levy are all para-tariffs. The UNCTAD17 defines para-tariffs as follows;
“Measures implemented to control or affect the prices of imported goods in order to, inter alia, support the domestic price of certain products when the import prices of these goods are lower; establish the domestic price of certain products because of price fluctuation in domestic markets, or price instability in a foreign market; or to increase or preserve tax revenue. This category also includes measures other than tariffs measures that increase the cost of imports in a similar manner, i.e. by a fixed percentage or by a fixed amount.”
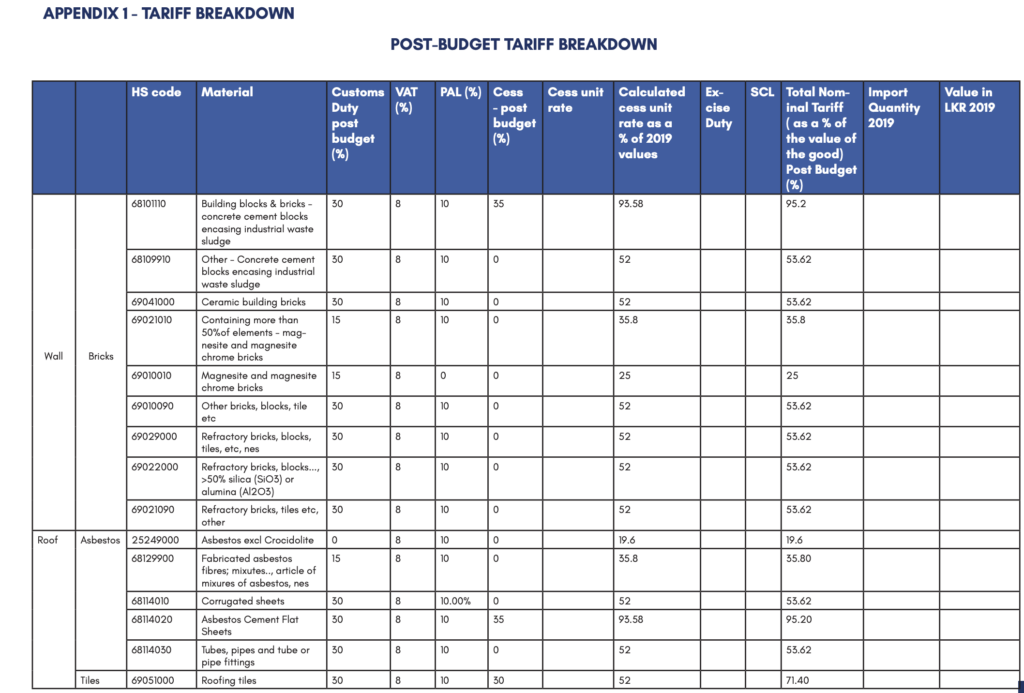
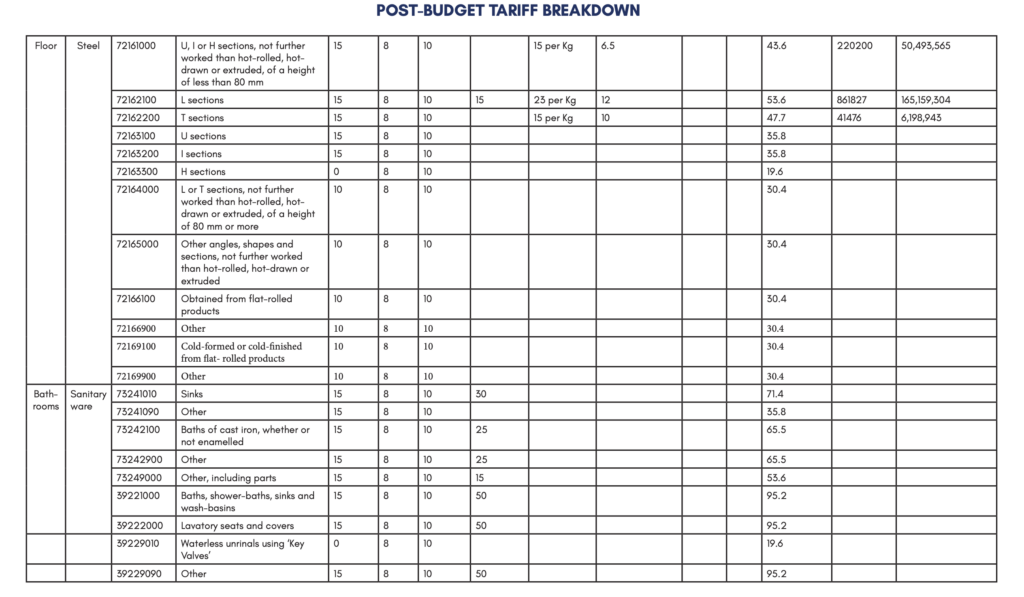
For example, the taxes levied on imported sinks under the HS Code 7324.10.10 is illustrated below.
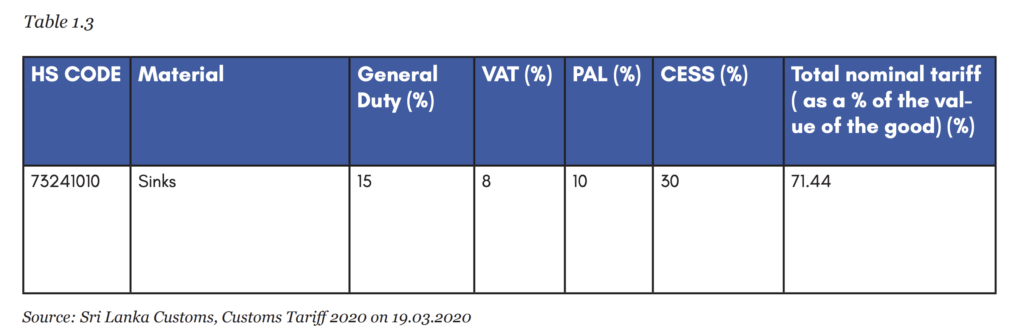
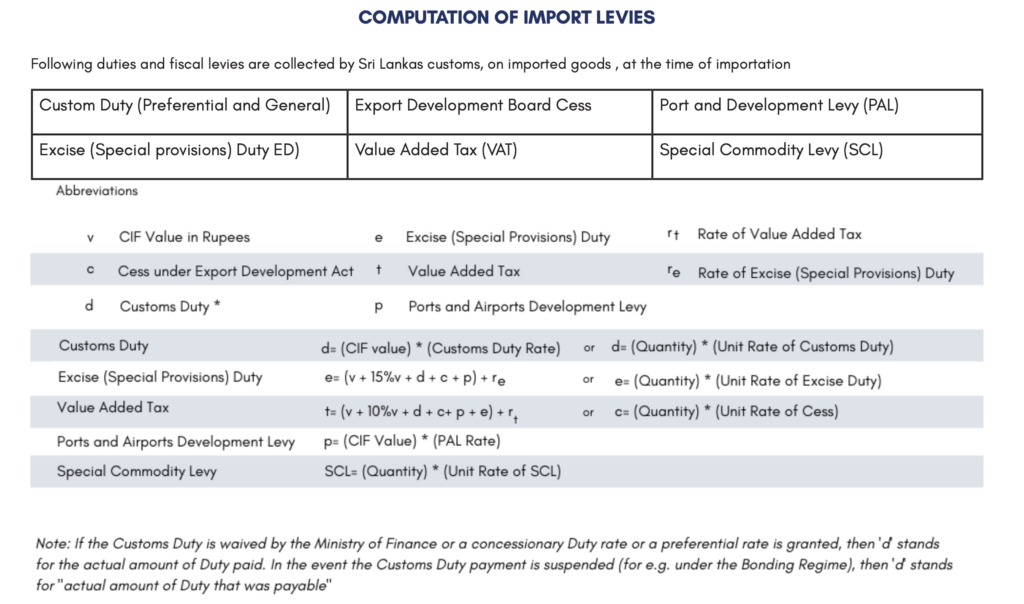
As illustrated above, sinks brought under this HS code are not only subject to general duty but also VAT, PAL and CESS. The NBT and ESC were removed in 2019 as a part of broader tax reform.18 The cumulative result of these para-tariffs is that the final tax on the goods comes to 71.44%. Intuitively, one would assume that the total tax should amount to 63%, the reason for this not being the case is the way these taxes are calculated.
Referring to Table 1.4 below which shows how the Department of Customs calculates the final tariff, what one can see is that taxes compound, effectively increasing the final tariff value.
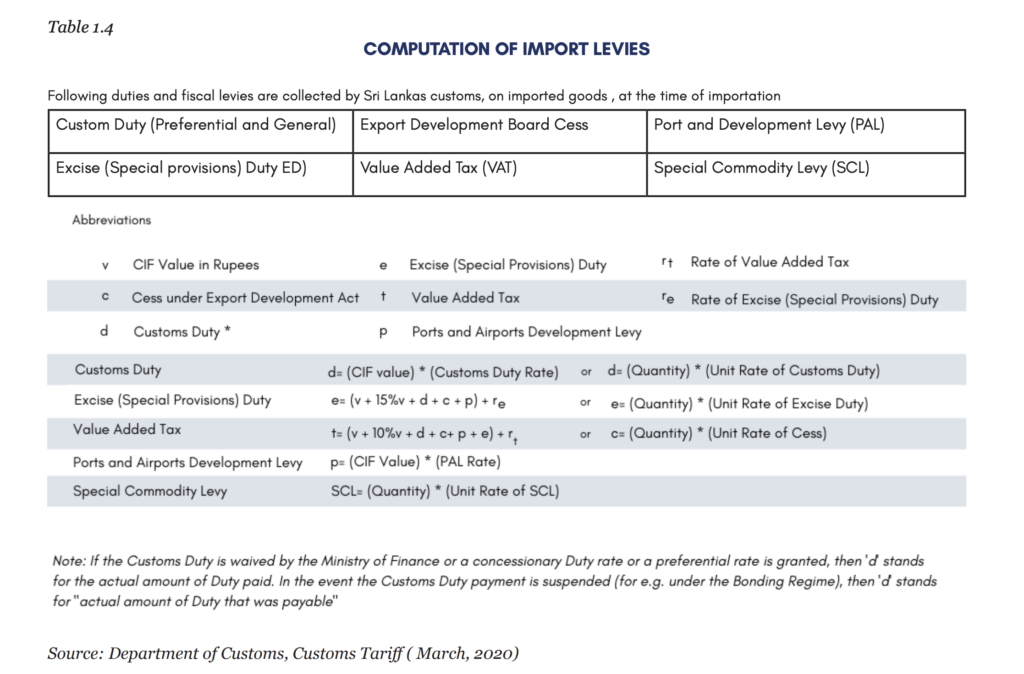
These para-tariffs have been identified to serve a more protectionist purpose, than one of revenue generation, especially given that the rates for tariffs such as CESS vary from product to product, and are frequently subject to change.
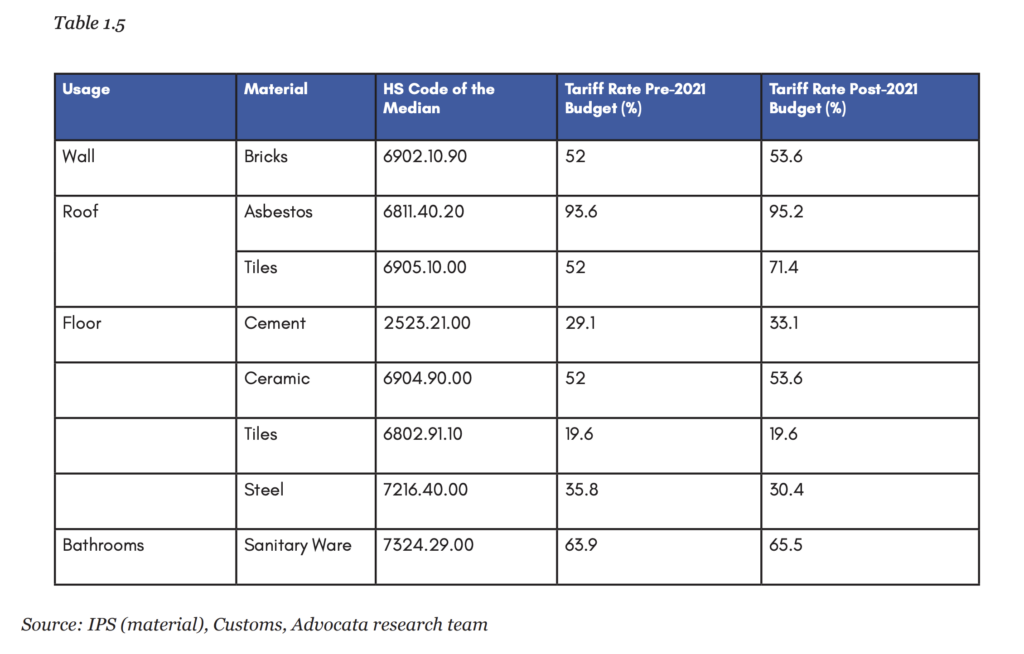
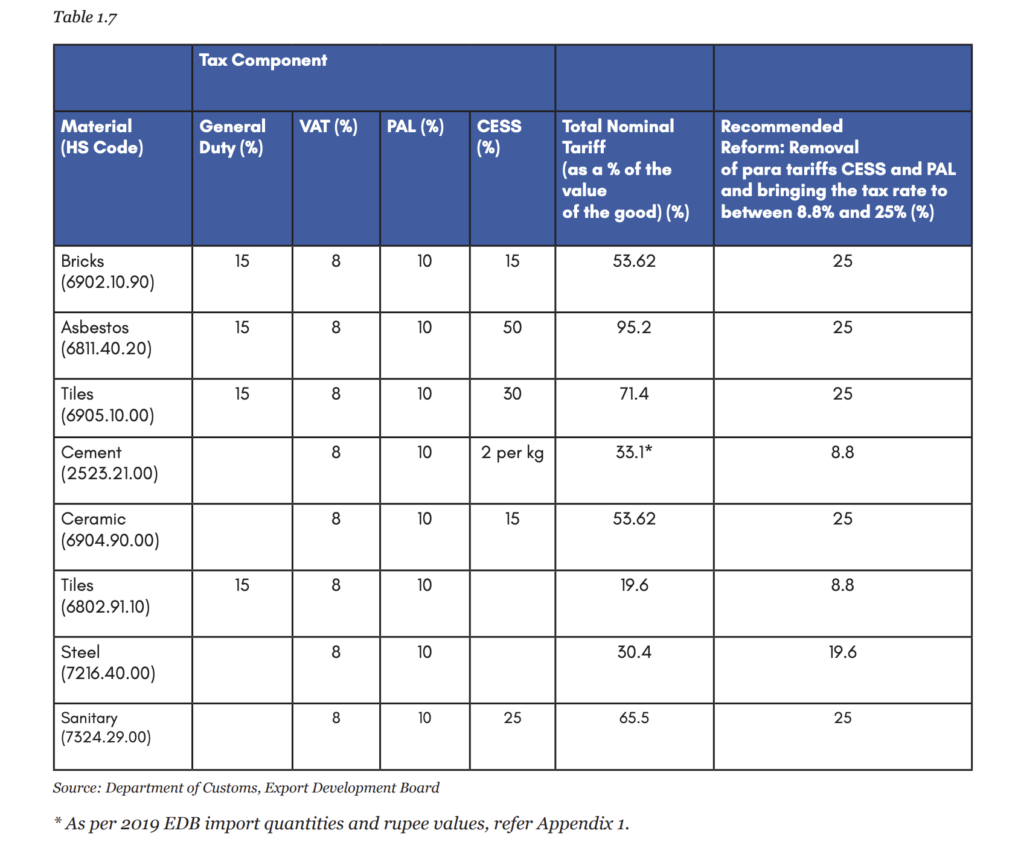
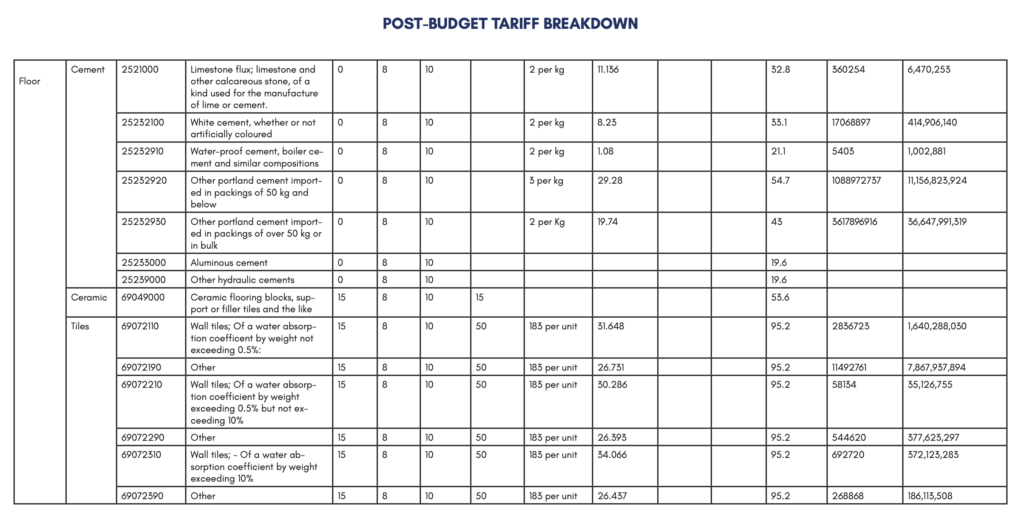
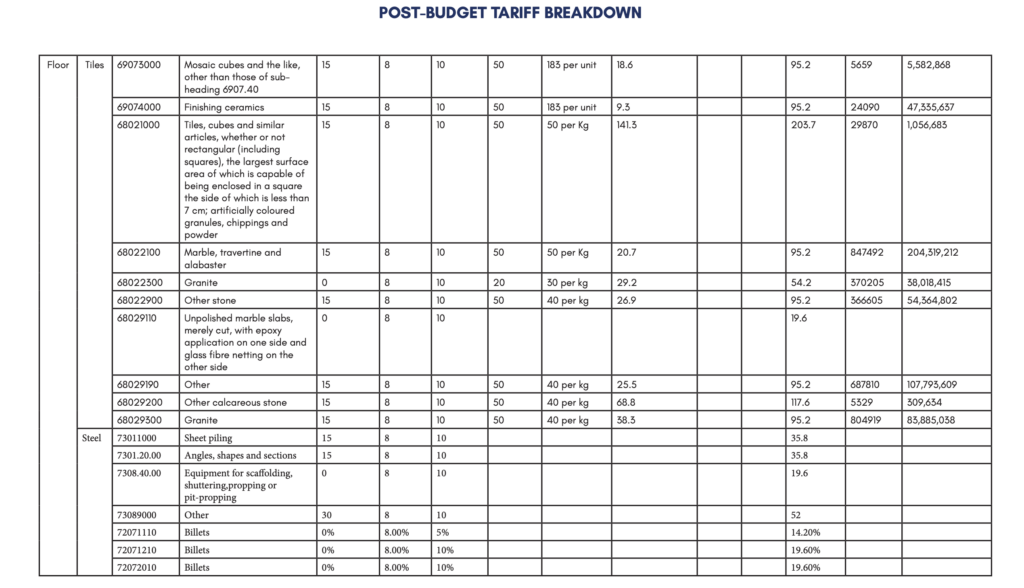
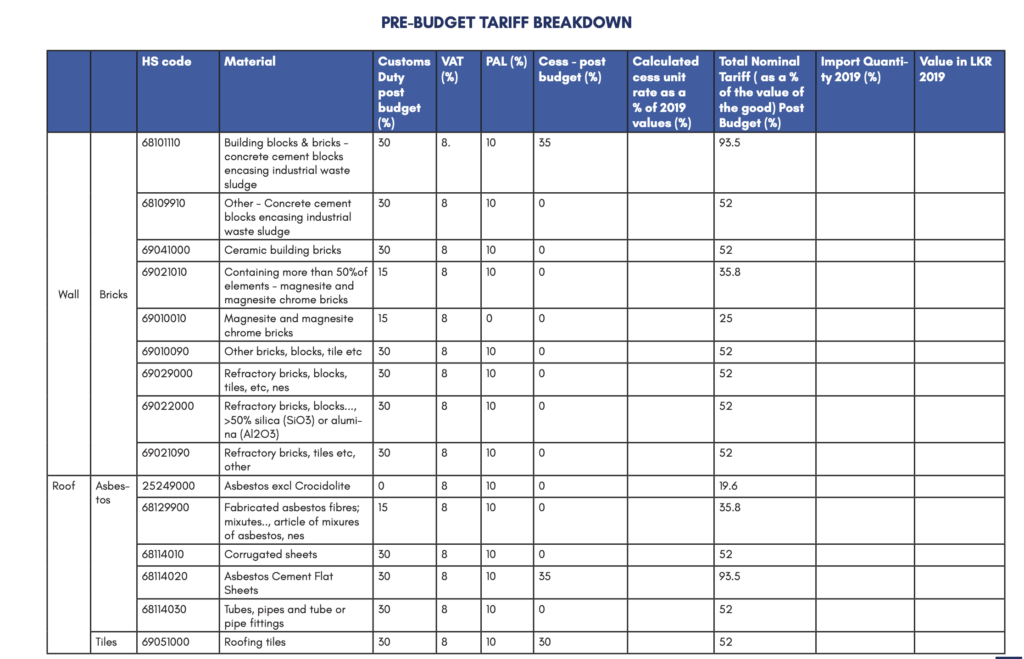
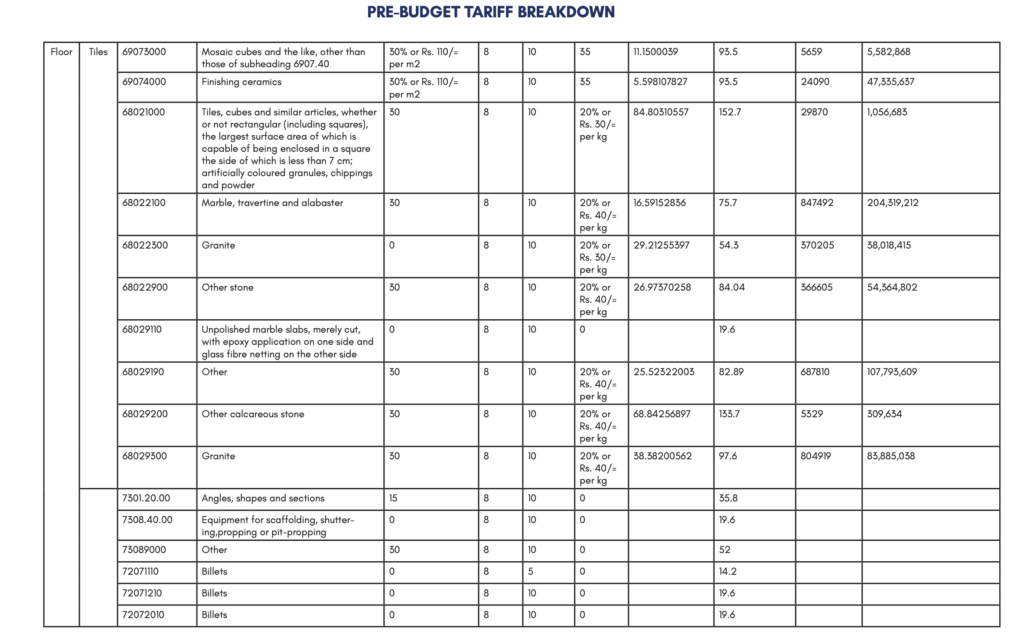
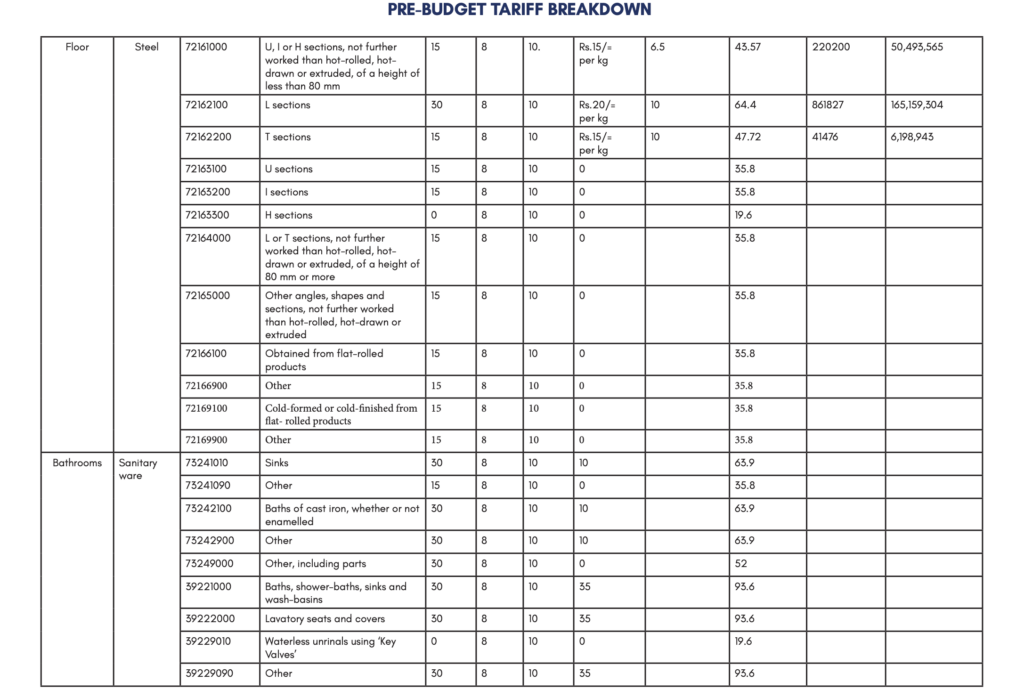
Looking at the basic materials required, the average tariff levied across multiple HS codes can range from 14.2% to as high as 203.7%. A detailed breakdown of the final tariffs for each HS code can be found in Appendix 1. The table below illustrates the problem, looking at a sample of HS codes based on interviews with stakeholders. The table provides the tariff rate of the median HS Code in each material category, as a representation of the sample.
Below are the percentage distributions of occupied housing units according to floor, wall and roof covering material19
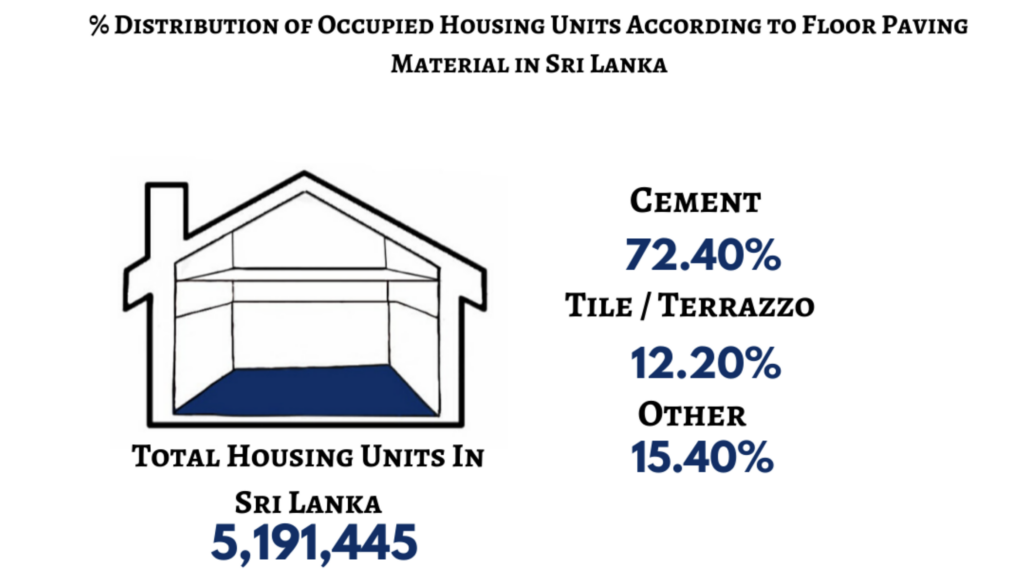
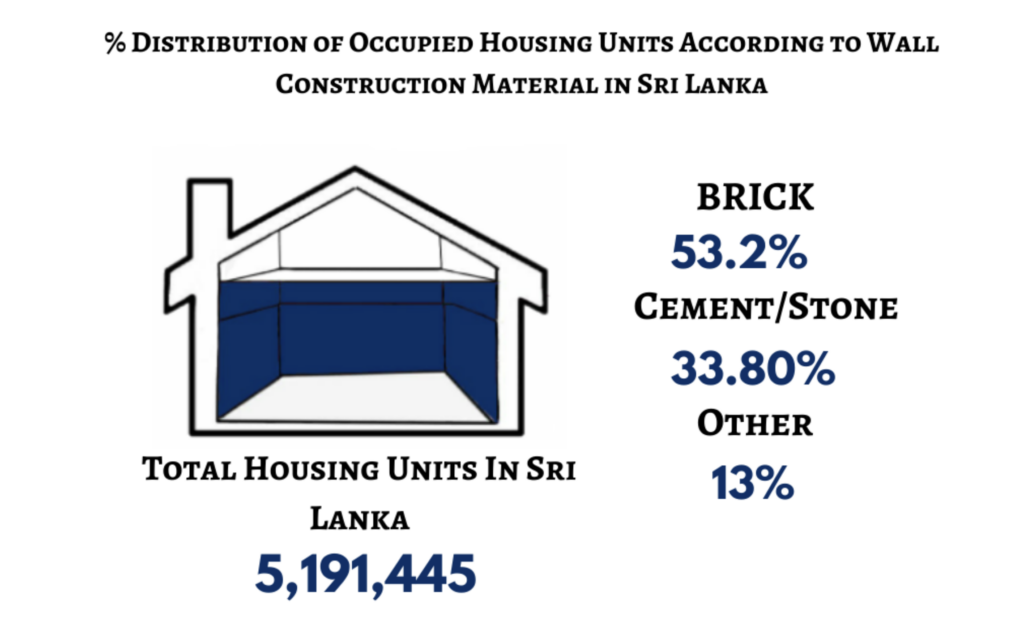
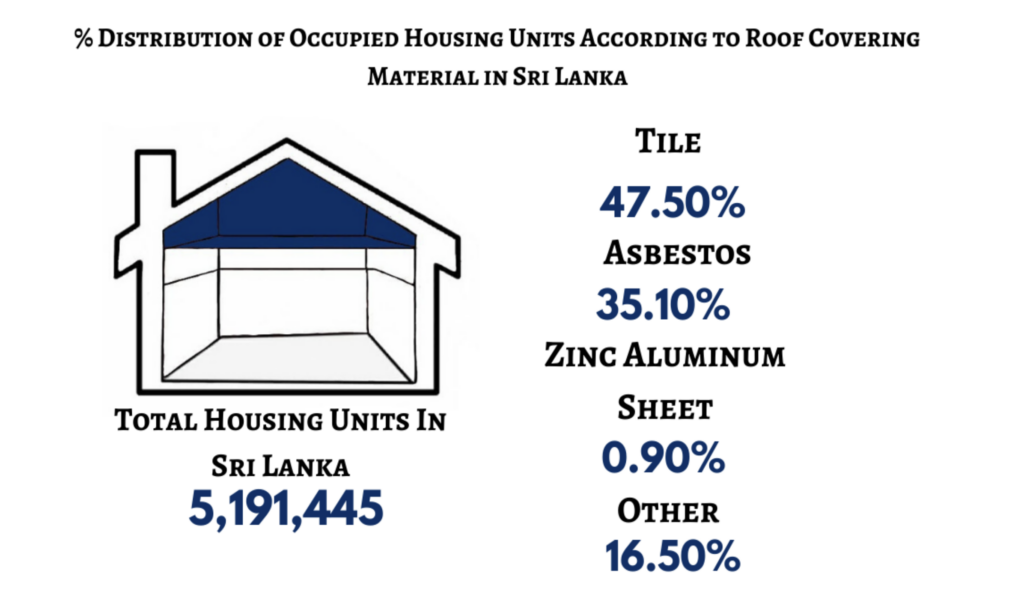
Source: Census of Population and Housing 2012, Department of Census and Statistics
The impact these high tariffs on construction material have on low and middle-income earners is evident by the large number of partly constructed, temporary, not yet plastered and homeless families in Sri Lanka.
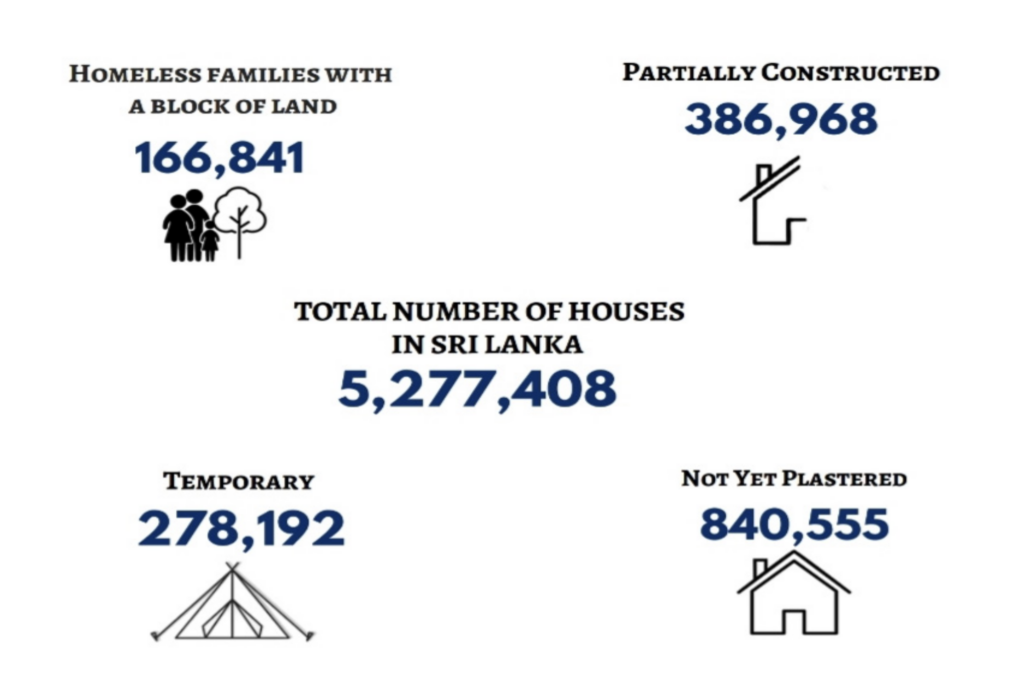
Source: Housing Needs Assessment Survey 2016, Department of Census and Statistics
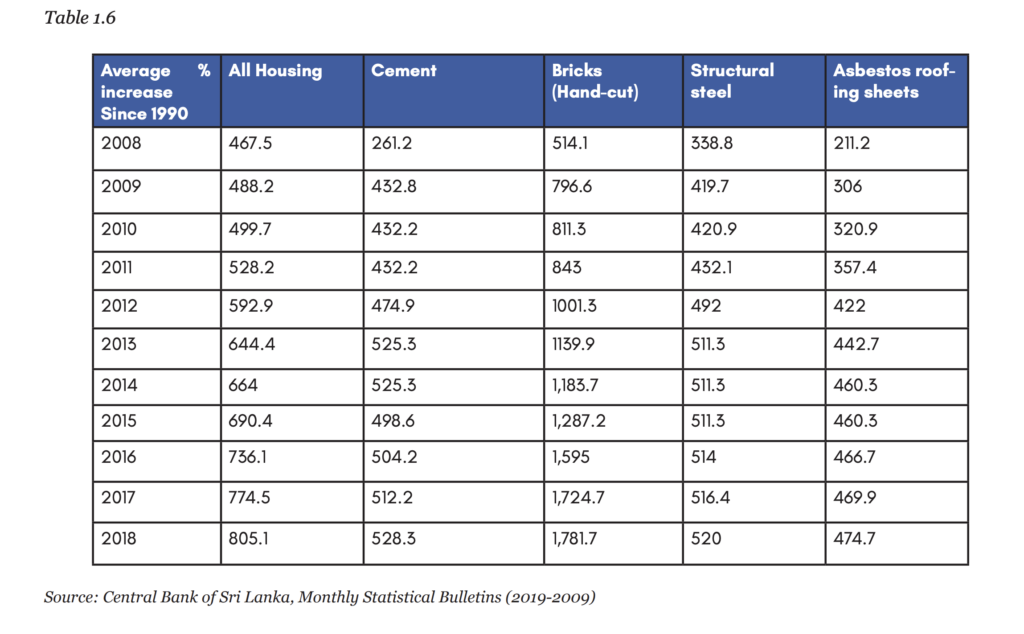
Since the 1990s, the cost of constructing a house in Sri Lanka has increased rapidly. To understand just how much the costs of the construction industry have increased, the Central Bank cost of construction index is a good place to start.
It shows how prices have increased in terms of percentages. It’s a good comprehensive introduction to understand how prices have increased through the years.
The table below shows how the prices have increased relative to 1990 values.
Improving access to affordable, adequate housing across Sri Lanka is a challenging task, with the high costs of materials being only one of the contributors to the problem. That being said, tariff reform remains to be a low hanging fruit, that would have a positive impact on the affordability of housing.
Given this, the report recommends that the tariffs CESS and PAL are brought down to 0%.
Sathya Karunarathne is a Research Executive at the Advocata Institute, and Aneetha Warusavitarana is the Research Manager at the Advocata Institute. They can be reached at [email protected] and [email protected]. The authors were assisted by Dilshani Ranawaka (Research Executive), Naqiya Shiraz (Research Intern), Vinuja Singharachchige and Joshua Karpinski (Research Intern).
The findings, interpretations, and conclusions expressed in this paper are entirely those of the authors and not necessarily of the Advocata Institute, its Board of Advisors or Directors.
The following methodology has been used in calculating the tariffs in this report.
1.1 Tariff rates obtained from customs tariff report uploaded on 19 March 2020.
1.2 Calculations are on imported material only.
1.3 For items that carry a unit rate of tax (eg: HS Code 7216.10.00, where CESS is stated as Rs 15/= per kg), the per unit rate was calculated using EDB 2019 import quantity and value data. This rate was applied to calculate the total nominal tariff. Refer Figure 1 below for the calculation method of the total nominal tariff.
1.4 In instances where the unit rate of tax and a percentage was provided (eg: HS Code 6802.23.00 where CESS is stated as 20% or Rs. 20/= per kg), the unit rate was calculated as a percentage, and whichever is higher was chosen for calculation of the total nominal tariff rate.
1.5 The data on expenditure deciles is taken from the 2012 Census of Population and Housing.
1.6 The data on housing needs are based on the most recent survey which was conducted in 2016.

1 Trade Policy Review, Report by the Secretariat, World Trade Organisation,27th September 2016, Accessed 29th of January 2021, https://www.wto.org/english/tratop_e/tpr_e/s347_e.pdf2 The Department of Census and Statistics, The Government of Sri Lanka, Annual Report,2012.
2 Government of Sri Lanka,The Department of Census and Statistics, Housing Needs Assessment and Data Survey, 2016. Accessed on July 9, 2020 https://drive.google.com/file/d/0B-H067SvwMyeT3ZhWGhtMnltVWc/view
3 The most commonly cited reason migrant workers for seeking work abroad is to save money for a house. A study on domestic migrant workers by Caritas Sri Lanka (2013) showed that for 61% – one of the reasons to migrate was to build a house. Numerous other surveys confirm this finding.
4 Uchida, Hirotsugu; Nelson, Andrew. “Agglomeration Index: Towards a New Measure of Urban Concentration” Washington, DC: World Bank. Accessed on July 13, 2020 https://openknowledge.worldbank.org/handle/10986/9039
5 HMU Chularathna, RMSR Rathnayake, KA Jayaratne, “Profile of Underserved Settlements City of Colombo”, Sevanatha Urban Resource Centre, September 2013. Accessed July 16, 2020 http://www.sevanatha.org.lk/news.html
6 Turning Sri Lanka’s Urban Vision into Policy and Action . UN Habitat for a Better Urban Future, 2012.http://documents1.worldbank.org/curated/en/665641468308350890/pdf/731820WP0P12800AL0UPN0Book005102012.pdf
7 Government of Sri Lanka,The Department of Census and Statistics, Housing Needs Assessment and Data Survey, 2016. Accessed on July 9, 2020
https://drive.google.com/file/d/0B-H067SvwMyeT3ZhWGhtMnltVWc/view
8 Based on interviews with stakeholders.
9 Study by the University of Moratuwa in 1995, found that the greatest demand was for a floor area ranging from 1000 to 2000 sq. ft.
10 WFSE Fernando,”Handbook for the Sri Lankan Housebuilder”, University of Moratuwa, 1995. Accessed on August 20, 2020 http://dl.lib.mrt.ac.lk/bitstream/handle/123/957/full-thesis.pdf?sequence=3&isAllowed=y2
11 Government of Sri Lanka, Ministry of Finance, Annual Report, 2019. Accessed on December 17,2020http://www.treasury.gov.lk/documents/publications/anualReports/2019/Annual%20Report%202019-20200625-rev2-eng.pdf
12 Government of Sri Lanka, Department of Census and Statistics, Household Income and Expenditure Survey, 2012, 30, Table 3.11. Accessed on November 10, 2020. http://www.statistics.gov.lk/IncomeAndExpenditure/StaticalInformation
13 Government of Sri Lanka, Central Bank, Annual Report, 2019, Accessed January 30 2021, https://www.cbsl.gov.lk/sites/default/files/cbslweb_documents/publications/annual_report/2019/en/15_Appendix.pdf
14 Government of Sri Lanka, Ministry of Finance, Annual Report, 2019. Accessed on December 17,2020http://www.treasury.gov.lk/documents/publications/anualReports/2019/Annual%20Report%202019-20200625-rev2-eng.pdf
15 Moore, Mick. “The Political Economy of Long-Term Revenue Decline in Sri Lanka”, February 2017. Accessed on November 20, 2020 http://dx.doi.org/10.2139/ssrn.3120545
16 Government of Sri Lanka, Ministry of Finance, Annual Report, 2019. Accessed on December 17,2020http://www.treasury.gov.lk/documents/publications/anualReports/2019/Annual%20Report%202019-20200625-rev2-eng.pdf
17 UNCTAD, “International Classification of Non-Tariff Measures”, United Nations, 2019. Accessed on December 11, 2020 https://unctad.org/en/ PublicationsLibrary/ditctab2019d5_en.pdf
18 Government of Sri Lanka, Inland Revenue Department, “Notice to The Taxpayers”, 2019. Accessed on November 20, 2020 https://www.taxadvisor.lk/data/uploads/implementation_of_new_tax_proposals_on_vat_and_nbt_.pdf;
19 Government of Sri Lanka, Department of Census and Statistics, Household Income and Expenditure Survey, 2012. Accessed on November10,2020 http://www.statistics.gov.lk/IncomeAndExpenditure/StaticalInformation